

Abstract
Objective
To describe sleep quality and sleep duration in primiparous women six months postpartum and to determine whether sleep quality is associated with 24-hour physical activity assessed using tri-axial wrist accelerometry and a novel analytic technique, functional data analysis (FDA).
Methods
Six months postpartum, participants wore a tri-axial wrist accelerometer for 7 days and completed the Pittsburgh Sleep Quality Index (PSQI). We categorized sleep quality as good (score ≤ 5) or poor (> 5). Data were summarized as vector magnitude of accelerations net of local gravity, or “Euclidean Norm Minus One” (ENMO, mg), in 5 second epochs. Using FDA, we modeled ENMO as a continuously changing, functional outcome predicted by sleep quality. We also compared mean total ENMO per 24-hour day, mean minutes of moderate to vigorous physical activity (MVPA) and of light activity/day and mean minutes of MVPA in 10-minute bouts/day by sleep quality.
Results
Of 365 women that completed the PSQI, 215 (59%) reported poor sleep quality. 296 women completed both the PSQI and valid accelerometry. With the exception of one brief period around noon, sleep quality was not significantly associated with 24-hour physical activity according to FDA. Women with poor sleep quality had slightly greater total mean activity, minutes of light activity and minutes of MVPA per day, but no difference in minutes of MVPA in at least 10-minute bouts.
Conclusion
Poor sleep quality is common 6 months postpartum. We identified no clinically significant differences in physical activity metrics between women with good and poor quality sleep.
Keywords: Sleep, physical activity, postpartum, accelerometry, sleep quality
INTRODUCTION
Physical activity during the postpartum period has many health benefits, such as improving sleep quality, reducing gestational weight gain, improving mood and decreasing risk for depressive symptoms (1). The demands of childrearing, however, can interfere with the postpartum woman’s pursuit of healthful physical activity (2). Research suggests that physical activity levels at 3 and 12 months postpartum are below recommended levels, such that women are not enjoying the benefits of physical activity at this transitional period (3).
Sleep is disrupted and redistributed in the postpartum period. Whether assessed subjectively or objectively, women in the postpartum period are more likely to have interrupted, fragmented, and lower-quality sleep (4–6). Understanding factors, such as sleep quality, that may promote physical activity engagement during postpartum would help guide recommendations for those who are underactive and could provide health intervention targets for the problem of inactivity among postpartum women.
Sleep duration and quality are related to physical activity levels in various populations. Moderate to vigorous physical activity (MVPA) is associated with shorter time to fall asleep, greater time in deep sleep, and less daytime sleepiness (1). One pilot trial found that a light intensity exercise program done 3 times per week improved sleep in the postpartum period (7). Though there are numerous reports concluding that higher levels of physical activity improve sleep, fewer examine whether those with better sleep quality are more likely to be physically active. In older women there is support for both a bidirectional relationship between sleep and objective assessment of physical activity and a unidirectional relationship between sleep and physical activity (8).
Based on a comprehensive literature search, the 2018 Physical Activity Guidelines Advisory Committee concluded that there is insufficient evidence to understand the association between physical activity and the quality of sleep postpartum and recommended observational studies to explore the associations between physical activity and sleep quality in postpartum women (9). We contend that understanding the other direction of relationship, that is, between sleep and physical activity, may also be fruitful in postpartum women, given that poor sleep is common in this population (10). If poor sleep quality is found to be associated with less physical activity, then interventions focused on sleep quality in postpartum women may help to achieve the goal of reducing inactivity in this population.
We identified no studies assessing the association between sleep quality and physical activity using objectively assessed activity in the later postpartum period. In addition to sparse information about the association between sleep quality and physical activity in postpartum women, most information to date has focused on moderate to vigorous physical activity in at least 10 minute bouts and on mean activity averaged over a day. However, the recently updated Physical Activity Guideline no longer recommends a focus on 10-minute bouts of activity, as total moderate-to vigorous activity, as well as light-intensity activity has been shown to have important health benefits regardless of bout length (11). There is also increasing attention to describing total activity that includes both light-intensity and MVPA over a 24-hour period in populations that tend to have more irregular and sporadic activity (12). We therefore focused our analysis on total activity, which incorporates all intensities.
The aims of this cross-sectional study are 1) to describe sleep quality and sleep duration in a group of primiparous women six months after vaginal birth and 2) to determine whether sleep quality is associated with overall 24-hour physical activity, assessed using conventional methods as well as a novel analytic technique, functional data analysis of vector magnitude of accelerations over an average day. This type of analysis can delineate whether the effect of sleep quality on physical activity varies at different time-points in the course of a 24-hour day.
METHODS
This is an ancillary study to an ongoing cohort study. Methods for the primary study have been published (13). This study was approved by IRBs at the participating sites and all participants completed written informed consent. Women were included in the primary study if they were 18 years or older, pregnant in the third trimester with their first child, planning vaginal delivery, English- or Spanish-speaking, without medical problems that precluded physical activity and living within a 60-mile radius of the study site. Because the purpose of the primary study is to better understand how certain postpartum factors including physical activity impact pelvic floor health one year after vaginal childbirth, women that delivered by cesarean or preterm were subsequently excluded after delivery. We are continuing to follow the remaining population for one year postpartum. Pertinent to the current analysis, at 5–7 months postpartum (hereafter referred to as 6 months), participants were asked to wear a wrist-worn accelerometer for 7 days and also to complete the Pittsburgh Sleep Quality Index (PSQI) (14). Participants also completed comprehensive study questionnaires at enrollment, during the third trimester, at 8 weeks postpartum and at 1 year postpartum; they did not complete these more comprehensive questionnaires at 6 months postpartum.
The PSQI, validated in both English and Spanish, consists of 19 items that measure seven different aspects of sleep: subjective sleep quality, sleep latency, sleep duration, sleep efficiency, sleep disturbance, use of sleeping medication and daytime dysfunction due to sleepiness. Respondents are asked to reflect on their sleep characteristics over the past month. Each item is weighted on a 0–3 interval scale and the items are summed to obtain a global PSQI score, with values ranging from 0 to 21. Consistent with previous reports, we dichotomized sleep quality as good (≤ 5) or poor (> 5) (14). In addition to the PSQI, participants also completed an activity checklist summarizing types of activities performed based on the Bone Loading History Questionnaire, designed to assess loads applied to the hip and spine during various activity types(15).
Study staff delivered a tri-axial accelerometer (Actigraph GT9X LINK, Actigraph™, Inc., Pensacola, FL) to participants at 6 months postpartum and asked them to wear it on the non-dominant wrist for 24 hours per day over 7 days. Detailed accelerometry procedures are summarized elsewhere (16). Briefly, accelerometers were initialized using ActiLife 6.13.0 software (Pensacola, FL) to collect data at 80 Hz, to begin data collection at midnight, and to display date and time so that the device would serve as a watch. Accelerometers did not display any physical activity parameters. Study staff retrieved the devices, downloaded the acceleration data and converted them to raw files for further processing. At least 4 days of wear, with at least one weekend day, and at least 10 hours of wear on weekdays and 8 hours of wear on a weekend day, were required for adequate accelerometry (17). We used GGIR V1.5–21, an R-package designed to process multi-day raw accelerometer data and applied quality control measures as per van Hees et al. (18).
Physical activity measurement by accelerometry has advanced recently to express the intensity of movement using vector magnitude of accelerations in short intervals of time such as 5 second “epochs” (19). ENMO (Euclidean Norm Minus One) is a summary metric for acceleration data and represents the vector magnitude of three axial measures minus the contribution of gravity (1 g). The greater the intensity of movement and duration of activity in the summed 5-second epochs, the greater the ENMO value. Based on Bakrania (20) and Hildebrand (21) ENMO values between 25.8 and 100.6 mg correspond to light activity and > 100.6 mg to moderate to vigorous physical activity (MVPA) .
We compared demographics and relevant medical history between groups categorized by good vs poor sleep quality. We compared continuous variables between groups using independent samples t-tests with pooled variances, Satterthwaite’s test when variances were unequal based on the folded F test, or the Wilcoxon rank sum test when variables were not consistent with normality; and categorical variables, using chi-squared tests or Fisher’s exact tests, as appropriate (22).
For the primary analysis of the effect of sleep on physical activity, we used functional data analysis (FDA). Plotting physical activity over the entire course of a 24-hour day can provide confidence bands for the effects of sleep quality on physical activity continuously over a 24-hour period. To perform FDA (22), we summarized and plotted ENMO in each of the 17, 280 5-second epochs of an average day. We excluded one woman with anomalous, implausibly high values of ENMO. Using the FDA methodology and R package fda, we modeled ENMO as a continuously changing, functional outcome that was predicted by the dichotomous variable of good or poor sleep quality based on a single administration of the PSQI. Modeling proceeded using B-splines to produce a smoothed representation of the data and generalized cross-validation to identify tuning parameters (22). The software produced pointwise 95% confidence bands at each and every available 5-second epoch during the day, allowing the effect of sleep quality to vary over the 24-hour period, with tests for significant effects of sleep quality by a permutation F-test for functional data (22).
In addition to the FDA analysis, as secondary outcomes, we also compared total mean ENMO averaged over all epochs in the entire week of accelerometry, total mean minutes per day of light activity, total mean minutes per day of MVPA, and mean minutes per day of MVPA constrained to occur in at least 10-minute bouts between participants with good sleep vs poor sleep quality. For example, minutes per day and per week of MVPA were calculated as the total duration of epochs where ENMO exceeded 100.6 mg. MVPA in 10-minute bouts has been used widely to assess the health benefits of physical activity. While recently released updated physical activity guidelines no longer include the restriction of MVPA to 10-minutes bouts, as total MVPA confers similar health benefits, we included this analysis to enable better comparisons between our results and the extant literature. (1).
We plotted each total mean ENMO and total mean minutes of MVPA versus total PSQI score and calculated the Pearson or Spearman correlation coefficient as appropriate.
We compared the analysis dataset to participants in the parent study who did not have valid accelerometry at 6 months postpartum or who did not complete the PSQI, using similar methods. Statistical tests were performed at the conventional 5% significance level. All analyses were performed in SAS v9.4 (Cary, NC), except that FDA analysis was conducted using R package fda.
RESULTS:
Study Population
Study participants included 399 women that completed the PSQI and/or 6-month accelerometry. Of these, 365 completed the PSQI, 332 had adequate accelerometry data, and 296 had both a complete PSQI and adequate accelerometer data. Figure 1 demonstrates participant flow from enrollment in the parent study to the analytic sample for this analysis. There were no statistically significant differences in age, race and work status between women in the study population (n=399) and enrolled participants that completed neither adequate accelerometry nor the PSQI (n=56), however, non-completers were more likely to self-identify as Hispanic and less likely to have graduate level education than the study population (p<0.001 for both). The same findings were noted in comparing women that completed both adequate accelerometry and the PSQI (n=296) versus enrolled participants that did not (n=159).
Fig 1 .

Participant flow from enrollment to the 6-month postpartum period
Characteristics of the full cohort are summarized in Table 1. The mean age of the cohort was 27.9 (SD 5.1) years and mean time since delivery 7.2 (SD 0.9) months. The cohort was predominantly White/Caucasian race (91.7%), non- Hispanic ethnicity (79.2%), educated (60% completed 4 years of college or more), non-obese (19% BMI >30), and healthy (3% had diabetes, 1.2% had hypertensive disorders). We did not include questions on work status and breastfeeding on the questionnaire completed by participants at 6 months postpartum, but women completed these questions at 8 weeks and one year postpartum. At 8 weeks postpartum, 8.9% of the cohort were working at least 30 hours per week and 88% were breastfeeding. At one year postpartum, 50% of 313 respondents that had completed the 1-year visit were working at least 30 hours per week and 46% were breastfeeding.
Table 1.
Baseline characteristics
| N=399 | |
|---|---|
| Age at enrollment, mean ± SD | 27.9 ± 5.1 |
| Ethnicity | |
| Non-Hispanic | 316 (79.2%) |
| Hispanic/Latina | 83 (20.8%) |
| Race | |
| White/Caucasian | 366 (91.7%) |
| Asian/Asian American | 18 (4.5%) |
| Black/African American | 6 (1.5%) |
| American Indian/Alaskan Native | 3 (0.8%) |
| Native Hawaiian/Pacific Islander | 2 (0.5%) |
| Do not wish to identify | 4 (1.0%) |
| Education | |
| Less than 12th grade | 15 (3.8%) |
| Completed high school or equivalent | 56 (14.0%) |
| Some college/associate degree | 87 (21.8%) |
| Completed 4 years of college or more | 241 (60.4%) |
| Months since delivery, mean ± SD | 7.2 ± 0.9 |
| BMI at 8 weeks, kg/m2 | |
| BMI < 25 | 199 (51.2%) |
| BMI 25 to < 30 | 116 (29.8%) |
| BMI >30 | 74 (19.0%) |
| Diabetes | 12 (3.0%) |
| Hypertension | 5 (1.2%) |
| Work Status at 8 weeks | |
| Working full-time (at least 30 h/wk) | 34 (8.9%) |
| Working part-time | 19 (5.0%) |
| Work status at 1 year (n=313) | |
| Full time | 158 (50.5%) |
| Part time | 59 (18.9%) |
| Breastfeeding at 8 weeks | 338 (88.3%) |
| Breastfeeding at 1 year (n=313) | 143 (45.7%) |
| Health rating at 8 weeks | |
| Excellent | 80 (20.9%) |
| Very good | 145 (37.9%) |
| Good | 127 (33.2%) |
| Fair | 28 (7.3%) |
| Poor | 3 (0.8%) |
Presented as n (%), except as otherwise noted.
IQR, Interquartile Range.
Except where otherwise stated, N=399. At the time of analysis, 313 women had reached the 1-year endpoint for the primary study.
Sleep quality
The time period in which sleep was assessed preceded the accelerometry assessment in 268 women, while in 11 women, the 2 assessments overlapped in time and in 16, the sleep assessment followed accelerometry. Table 2 summarizes PSQI results. Two hundred fifteen of 365 women (59%) reported poor sleep quality, as indicated by a PSQI total score > 5. The median PSQI score was 6 (IQR 4–9, Range 0–17). Mean sleep duration was 6.9 hours (SD 3.0) per night. One hundred twenty (33%) reported sleeping 7 or more hours per night and 66 (18%) reported less than 5 hours per night. A considerable proportion of women reported medium or high sleep disturbance (16%), medium or high sleep latency (31%), medium or high day dysfunction at work due to sleepiness (19%), and suboptimal sleep efficiency (30% sleep less than 75% of their time in bed sleeping). Overall 28% rated their sleep quality as fairly bad or very bad, though 93.7% denied using sleeping-aid medication in the past month.
Table 2.
Results of the Pittsburgh Sleep Quality Index (PSQI) at 6 months postpartum
| Scale | N=365 |
|---|---|
| OVERALL RESULTS | |
| PSQI Total Score | |
| Median, [IQR] | 6 [4,9] |
| Range | [0,17] |
| Number of minutes to fall asleep, median [IQR] | 15 [10,30] |
| Hours of actual sleep, mean ± SD | 6.9 ± 3.0 |
| Poor Sleep Quality (PSQI total >5) | 215 (58.9%) |
| Good Sleep Quality (PSQI total < 5) | 150 (41.1%) |
| SUBSCALE RESULTS | |
| Duration of sleep | |
| 7 or more hours sleep per night | 120 (32.9%) |
| 6 to 7 hours sleep per night | 98 (26.8%) |
| 5 to 6 hours sleep per night | 81 (22.2%) |
| Less than 5 hours sleep per night | 66 (18.1%) |
| Sleep Disturbance | |
| None sleep disturbance | 17 (4.7%) |
| Low sleep disturbance | 291 (79.7%) |
| Medium sleep disturbance | 56 (15.3%) |
| High sleep disturbance | 1 (0.3%) |
| Sleep latency | |
| None sleep latency | 136 (37.3%) |
| Low sleep latency | 117 (32.0%) |
| Medium sleep latency | 89 (24.4%) |
| High sleep latency | 23 (6.2%) |
| Day dysfunction due to sleepiness | |
| No effect on daily work | 93 (25.5%) |
| Low effect on daily work | 203 (55.6%) |
| Medium effect on daily work | 61 (16.7%) |
| High effect on daily work | 8 (2.2%) |
| Sleep efficiency | |
| Sleep hours 85% or more of time in bed | 165 (45.2%) |
| Sleep hours 75% to 84% of time in bed | 91 (24.9%) |
| Sleep hours 65% to 74% of time in bed | 54 (14.8%) |
| Sleep hours 64% or less of time in bed | 55 (15.1%) |
| Overall sleep quality | |
| Very good sleep quality | 46 (12.6%) |
| Fairly good sleep quality | 215 (58.9%) |
| Fairly bad sleep quality | 89 (24.4%) |
| Very bad sleep quality | 15 (4.1%) |
| Need meds to sleep | |
| Not during the past month | 342 (93.7%) |
| Less than once a week | 14 (3.8%) |
| Once or twice a week | 3 (0.8%) |
| Three or more times a week | 6 (1.6%) |
Compared to women reporting good sleep quality, those reporting poor sleep quality were of similar age, ethnicity, race, and education (Table 3). There were no differences in work status or breastfeeding at 8 weeks and one year postpartum. Women reporting poor sleep quality had a non-significantly higher BMI (26.4 vs 25.3 kg/m2, p=0.094) and were more likely to have diabetes, generally gestational (4.7% vs 0.7%, p=0.029).
Table 3.
Participant characteristics according to sleep quality
| Good sleep quality (</= 5) N=150 | Poor sleep quality (>5) N=215 | P | |
|---|---|---|---|
| Age at enrollment, mean ± SD* | 27.7 ± 5.1 | 28.1 ± 5.1 | 0.678 |
| Ethnicity | 0.825 | ||
| Hispanic/Latina | 30 (20.0%) | 41 (19.1%) | |
| Non-Hispanic/Latina | 120 (80.0%) | 174 (80.9%) | |
| Race | 0.107 | ||
| White/Caucasian | 135 (90.0%) | 199 (92.6%) | |
| American Indian/Alaskan Native | 1 (0.7%) | 2 (0.9%) | |
| Asian/Asian American | 6 (4.0%) | 11 (5.1%) | |
| Black/African American | 5 (3.3%) | 0 (0%) | |
| Native Hawaiian/Pacific Islander | 2 (1.3%) | 0 (0%) | |
| Do not wish to identify | 1 (0.7%) | 3 (1.4%) | |
| Education | 0.717 | ||
| Less than 12th grade | 6 (4.0%) | 8 (3.7%) | |
| Completed high school or equivalent | 18 (12.0%) | 30 (13.9%) | |
| Some college/associate degree | 29 (19.3%) | 50 (23.3%) | |
| Completed 4 years or more years of college | 97 (64.7%) | 127 (59.1%) | |
| BMI (kg/m2) at 8 weeks, kg/m2, mean ± SD (missing = 9) | 25.3 ± 4.4 | 26.4 ± 5.6 | 0.094 |
| Diabetes | 1 (0.7%) | 10 (4.7%) | 0.029 |
| Hypertension (missing = 1) | 4 (2.3%) | 1 (0.5%) | 0.074 |
| Work Status full- or part-time at 8 weeks (missing = 12) | 16 (10.9%) | 31 (15.1%) | 0.288 |
| Work Status full- or part-time at 1 year** (missing = 74) | 80 (69.5%) | 122 (69.3%) | 0.964 |
| Health rating at 8 weeks (missing = 12) | 0.019 | ||
| Excellent | 37 (25.2%) | 37 (18.0%) | |
| Very good | 60 (40.8%) | 74 (35.9%) | |
| Good | 46 (31.3%) | 71 (34.5%) | |
| Fair | 4 (2.7%) | 21 (10.2%) | |
| Poor | 0 (0%) | 3 (1.5%) |
Still in study flow
Unless otherwise specified, missing responses to a specific variable = 0
Relationships between sleep quality and physical activity
Results from the FDA analysis are summarized in Figure 2. As can be seen in this figure, activity rises between early morning and noontime, drops somewhat and then rises again, tapering off over the afternoon and evening. Women with good quality sleep had less activity at 3am, noon, and 8pm; however, of all 5-second epochs analyzed, this was statistically significant only briefly around noon.
Fig. 2:
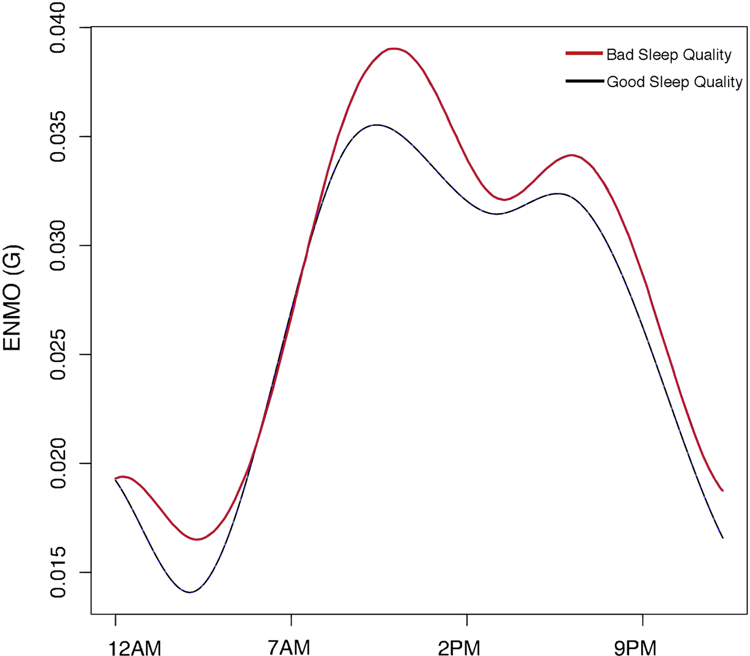
Functional data analysis results. This regression function demonstrates the difference in ENMO (in mg assessed in 5-second epochs over the course of 24 hours) for women with good sleep, beyond the ENMO for women with poor quality sleep. The differences throughout the day, analyzed by permutated F-tests in 5-second epochs throughout an average 24-hour period, reached statistical significance only briefly around noon .
Total activity intensity, as reflected by the mean total ENMO averaged over all 5-second epochs per day, was slightly lower in women with good sleep quality (26.8 mg for good sleep vs 28.4 for poor sleep, p=0.015). This is reflected by slight decreases in both total light activity and total MVPA in women with good sleep quality (Table 4). However, median MVPA in 10-minute bouts was similar between groups (2.0 (IQR 0, 8.4; range 0–103.6) minutes/day for good and 2.1 (IQR 0, 10.0; range 0–60.1) minutes/day for poor sleep quality (p=0.839). The types of activities that participants reported doing for at least 10 minutes per week were also similar between women with good and poor sleep quality (Table 5.) When evaluating the PSQI score as a continuous variable instead of a dichotomized variable (good vs poor sleep), the score was not correlated with total mean ENMO (Figure 3) or with total mean MVPA (Figure 4). Additionally, we evaluated the effect of two sleep quality subscales, duration of sleep and day dysfunction due to sleepiness and found no association between either subscale (dichotomized as > 7, 6–7 hours vs 5–6, < 5 hours, and no/low effect vs medium/high effect, respectively) and mean total ENMO (data not shown).
Table 4.
Physical activity metrics according to sleep quality.
| N=295 | Good sleep quality N=119 | Poor sleep quality N=176 | P |
|---|---|---|---|
| Total ENMO/day* | 0.015 | ||
| Mean(SD) | 26.8 (6.1) | 28.4 (6.3) | |
| Median(IQR) | 26.0 (22.5, 30.3) | 28.2 (24.3, 32.6) | |
| ange | (12.8, 49.0) | (14.3,49.4) | |
| Total minutes of MVPA/day** | 0.023 | ||
| Mean(SD) | 82.4 (30.4) | 91.1 (34.6) | |
| Median(IQR) | 78.1(62.3, 99.9) | 90.2 (65.0, 111.9) | |
| Range | (27.7, 174.5) | (22.1, 210.5) | |
| Minutes of MVPA in at least 10-minute bout/day | 0.839 | ||
| Mean (SD) | 7.2 (14.5) | 7.1 (10.7) | |
| Median (IQR) | 2.0 (0, 8.4) | 2.1 (0, 10.0) | |
| Range | (0, 103.6) | (0, 60.1) | |
| Total minutes light activity/day*** | 0.057 | ||
| Mean(SD) | 328.5 (94.6) | 339.1 (99.3) | |
| Median(IQR) | 334.0 (299.4, 376.3) | 359.9 (301.7, 398.7) | |
| Range | (0, 623.0) | (0, 516.6) |
ENMO: reflects all activity averaged over a 24-hour period
MVPA: Moderate to vigorous activity; includes all activity with ENMO value > 100.6 mg.
Light activity: includes all activity with ENMO value between 25.8 and 100.6 mg.
Table 5.
Types of activities reported by women according to sleep quality.
| Type of activity, ≥ 10 minutes/week | Good sleep quality N (%) N=119 | Poor sleep quality N (%) N=176 | P |
|---|---|---|---|
| Heavy lifting or work | |||
| Yes | 50 (42.4%) | 77 (44.5%) | 0.718 |
| No | 68 (57.6%) | 96 (55.5%) | |
| Hard running or exertion | |||
| Yes | 32 (27.1%) | 40 (22.7%) | 0.406 |
| No | 86 (72.9%) | 135 (77.1%) | |
| Bouncing/easy running | |||
| Yes | 61 (51.7%) | 88 (50.0%) | 0.776 |
| No | 57 (48.3%) | 88 (50.0%) | |
| Activities not involving bouncing, jumping, exertion or lifting | 0.713 | ||
| Yes | 93 (78.8%) | 141 (80.6%) | |
| No | 25 (21.2%) | 34 (19.4%) |
Some numbers do not add up to total due to missing data.
Fig. 3.

Relationship between total Pittsburgh Sleep Quality Index score and mean total physical activity (expressed as ENMO) over 24 hours
Fig. 4.

Relationship between total Pittsburgh Sleep Quality Index score and mean total minutes of moderate/vigorous physical activity over 24 hours
DISCUSSION
Over half of our population of women at 6 months postpartum reported poor sleep quality. We found no clinically meaningful differences between sleep quality and physical activity, either throughout the day as analyzed by FDA or according to activity intensity and type. Functional data analysis enables studying the effects of sleep quality on physical activity continuously over an entire 24-hour day. Thus, one can evaluate whether, for example, women with good sleep quality have greater total activity during certain morning hours, perhaps reflecting sufficient energy to exercise compare to women with poor sleep quality. In our population of primiparous women 6 months postpartum, we found essentially no associations between sleep quality and total activity over the course of 24 hours, except for a very brief period around noon when women with poor quality sleep had greater activity than women with good quality sleep. While values for total activity (expressed as ENMO), total minutes of MVPA and total minutes of light activity were all slightly greater in women with poor sleep quality, the differences seen were small. We also assessed MVPA in 10-minute bouts, the amount of sustained activity associated with many health outcomes, but found no difference by sleep quality.
One study suggested that specific types of physical activity, but not greater amounts of MVPA, were associated with improved sleep quality one year postpartum (23). Longitudinal data are sparse. A cohort study in college-aged students demonstrated a bidirectional but indirect relationship between sleep quality and physical activity, and the relationship was reliant on emotional factors (24). Another study of older women found no reciprocal associations between MVPA and sedentary time and total sleep time and sleep efficiency, assessed using wrist accelerometry (25). We designed our study to examine one direction of effect that has been understudied, that of sleep on physical activity. In our study, the vast majority of women assessed their sleep quality before their accelerometry wear period and therefore, our study is not well suited to explore the opposite direction of effect. Future prospective cohort studies of postpartum women will be valuable in further understanding the bidirectional nature of this association, as well as the role both sleep and physical activity play temporally in the genesis of postpartum mood disorders.
While women with poor sleep quality had slightly greater total ENMO per day, total minutes of MVPA per day and total minutes of light activity per day, the FDA revealed that this difference was significant for total ENMO only for a very brief time-point around noon. These marginally statistically significant results do not correspond to clinical significance. Indeed, the direction of effect does not lead to a promising clinical intervention—that is, one would not recommend striving for worse sleep quality in order to increase MVPA or light activity by 10 minutes per day. Good sleep quality does not appear to be leading to more purposeful exercise in this population, which may simply reflect the fact that new mothers have changing priorities and less time to devote to exercise.
The association between sleep and self-rated health that we observed has been reported in different populations, including young adults and nurses (26–28). Whether a general self-rating of health in early postpartum can predict longer term maternal sleep outcomes is worthy of follow-up, especially given the feasibility of this assessment.
By assessing physical activity using objective measures and sleep quality using a validated instrument, this study helps to address a gap in the literature about sleep and physical activity in postpartum women. The proportion of participants still eligible after delivery that adequately completed either the PSQI or accelerometry, 399 of 455 (88%), is high, though the proportion that completed both adequately was lower, 296 of 455 (65%). Participants that did not complete one or both of these study instruments were of similar age as those that did, but were more likely to be Hispanic and less likely to have completed higher education levels. Thus, our results may not be generalizable to other populations. As we excluded women that delivered by cesarean, our results may also not apply to those women. Study participants completed comprehensive questionnaires at 8 weeks and 1 year postpartum, but at 6 months completed only the PSQI and a physical activity questionnaire and therefore, we do not have contemporaneous data about potentially important factors such as current breastfeeding or work status. However, we found no differences between sleep quality at 6 months and breastfeeding or work status at either 8 weeks postpartum or, amongst participants who had completed the 1-year evaluation at the time of this analysis, 1 year. We chose the PSQI because it has been validated in both English and Spanish and has been used extensively, including in postpartum women. However, it may not adequately reflect sleep quality in postpartum women as it was not specifically designed for use in this population.
While one of the main strengths of this study is the objective assessment of physical activity with accelerometry, this tool lacks information on the context (i.e., recreation versus household activity), which at least one other study has found related to postpartum sleep quality (23). However, we found no difference between sleep quality and the types of activities participants reported engaging in. It is possible that the trends in increased activity during the night in women with poor sleep quality are due to responding to more demands made by their babies, but given that accelerometry cannot accurately identify specific activities, this is speculative only.
Another strength of this study is the use of FDA, which has the capability to allow the effects of good sleep on physical activity to vary at different times of day. It should be noted that our analysis used the average day, not the entire week in detail, primarily because participants did not have the identical numbers of days of data required by the FDA method. The analysis also did not differentiate weekend vs weekday days. A key computational limitation of FDA is that it utilized considerable resources on a high-performance computer cluster, especially in order to identify some of the tuning parameters in the analysis. This may impact the utility of this type of analysis in future studies.
In conclusion, this study found that a majority of primiparous women at 6 months postpartum after a vaginal delivery reports poor sleep, but that poor sleep was not associated with objectively measured periodic physical activity levels. Future studies may find activity level differences by accounting for the context in which sleep and activity are disrupted, redistributed, and moderated in the unique postpartum time period.
ACKNOWLEDGEMENTS
FUNDING
The project described was supported by Grant Number 1P01HD080629 from the Eunice Kennedy Shriver National Institute of Child Health and Human Development. Its contents are solely the responsibility of the authors and do not necessarily represent the official views of the National Institutes of Health.
Role of the funding source: The study sponsor had no role in the collection, analysis and interpretation of data or writing of the manuscript.
Footnotes
Publisher's Disclaimer: This is a PDF file of an unedited manuscript that has been accepted for publication. As a service to our customers we are providing this early version of the manuscript. The manuscript will undergo copyediting, typesetting, and review of the resulting proof before it is published in its final citable form. Please note that during the production process errors may be discovered which could affect the content, and all legal disclaimers that apply to the journal pertain.
Contributor Information
Jiqiang Wu, Department of Family and Preventive Medicine, University of Utah School of Medicine.
Brett Einerson, Department of Obstetrics and Gynecology, University of Utah School of Medicine.
Janet M. Shaw, Department of Health, Kinesiology, and Recreation, University of Utah College of Health.
Ingrid E. Nygaard, Department of Obstetrics and Gynecology, University of Utah School of Medicine.
Xiaoming Sheng, College of Nursing.
Ali Wolpern, Department of Health, Kinesiology, and Recreation, University of Utah College of Health.
Marlene J. Egger, Division of Public Health, Department of Family and Preventive Medicine, University of Utah School of Medicine.
REFERENCES
- 1.US Department of Health and Human Services. Physical Activity Guidelines for Americans 2nd ed. Wasington, DC: US Dept of Health and Human Services; 2018. [Google Scholar]
- 2.Shelton SL, Lee SS. Women’s self-reported factors that influence their postpartum exercise levels. Nurs Womens Health 2018;22(2):148–157. doi: 10.1016/j.nwh.2018.02.003. [DOI] [PubMed] [Google Scholar]
- 3.Evenson KR, Herring AH, Wen F. Self-reported and objectively measured physical activity among cohort of postpartum women: the PIN postpartum study. J Phys Act Health 2012;9(1):5–20. [DOI] [PMC free article] [PubMed] [Google Scholar]
- 4.Horiuchi S, Nishihara K. Analyses of mothers’ sleep logs in postpartum periods. Psychiatry Clin Neurosci 1999;53:137–139. [DOI] [PubMed] [Google Scholar]
- 5.Lee KA, McEnany G, Zaffke ME. REM sleep and mood state in childbearing women: sleepy or weepy? Sleep 2000;23:877–885. [PubMed] [Google Scholar]
- 6.Lawson A, Murphy KE. Relationship between sleep and postpartum mental disorders: A systematic review. J Affect Disorder 2015;176:65–77. doi: 10.1016/j.jad.2015.01.017. [DOI] [PubMed] [Google Scholar]
- 7.Yang CL, Chen CH. Effectiveness of aerobic gymnastic exercise on stress, fatigue, and sleep quality during postpartum: A pilot randomized controlled trial. Int J Nurs Stud 2018;77:1–7. [DOI] [PubMed] [Google Scholar]
- 8.Pettee Gabriel K, Sternfeld B, Shiroma EJ, Pérez A, Cheung J, Lee IM. Bidirectional associations of accelerometer-determined sedentary behavior and physical activity with reported time in bed: Women’s Health Study. Sleep Health 2017;3(1):49–55. doi: 10.1016/j.sleh.2016.10.001. [DOI] [PMC free article] [PubMed] [Google Scholar]
- 9.Holfeld B, Ruthig JC. A longitudinal examination of sleep quality and physical actually in older adults. J Appl Gerontol 2014;33(7):791–807. doi: 10.1177/0733464812455097. [DOI] [PubMed] [Google Scholar]
- 10.2018 Physical Activity Guidelines Advisory Committee. 2018 Physical Activity Guidelines Advisory Committee Scientific Report Washington, DC: US Department of Health and Human Services; 2018. [Google Scholar]
- 11.Okun ML. Distrubed sleep and postpartum depression. Curr Psychiatry Rep 2016;18(7):66. doi: 10.1007/s11920-016-0705-2. [DOI] [PubMed] [Google Scholar]
- 12.Bassett DR, Troiano RP, McClain JJ, Wolff DL. Accelerometer-based physical activity: total volume per day and standardized measures. Med Sci Sports Exerc 2015;47(4):833–838. doi: 10.1249/MSS.0000000000000468. [DOI] [PubMed] [Google Scholar]
- 13.Rosenberger ME, Fulton JE, Buman MP, Troiano RP, Grandner MA, Buchner DM, Haskell WL. The 24-Hour Activity Cycle: A New Paradigm for Physical Activity. Med Sci Sports Exerc 2019;51(3):454–464. doi: 10.1249/MSS.0000000000001811. [DOI] [PMC free article] [PubMed] [Google Scholar]
- 14.Nygaard IE, Clark E, Clark L, et al. Physical and cultural determinants of postpartum pelvic floor support and symptoms following a vaginal delivery: a protocol for a mixed-methods prospective cohort study. BMJ Open 2017;7:113. doi: 10.1136/bmjopen-2016-014252. [DOI] [PMC free article] [PubMed] [Google Scholar]
- 15.Buysse DJ, Reynolds CF, Monk TH, Berman SR, Kupfer DJ. The Pittsburgh Sleep Quality Index: A new instrument for psychiatric practice and research. Psychiatry Res 1989;28(2):193–213. [DOI] [PubMed] [Google Scholar]
- 16.Dolan SH, Williams DP, Ainsworth BE, Shaw JM. Development and reproducibility of the bone loading history questionnaire. Med Sci Sports Exerc 2006;38(6):1121–1131. [DOI] [PubMed] [Google Scholar]
- 17.Wolpern AE, Sherwin KJ, Moss WD, et al. Compliance with wrist-worn accelerometers in primiparous early postpartum women. Heliyon 2019;5. doi: 10.1016/j.heliyon.2019.e01193. [DOI] [PMC free article] [PubMed] [Google Scholar]
- 18.Troiano RP, McClain JJ, Brychta RJ, Chen KY. Evolution of accelerometer methods for physical activity research. Br J Sports Med 2014;48:1019–1023. doi: 10.1136/bjsports-2014-093546. [DOI] [PMC free article] [PubMed] [Google Scholar]
- 19.van Hees VT, Gorzelniak L, Dean Leon EC, et al. Separating movement and gravity components in an acceleration signal and implications for the assessment of human daily physical activity. PLoS One 2013;8:e61691. [DOI] [PMC free article] [PubMed] [Google Scholar]
- 20.Rowlands AV, Cliff DP, Fairclough SJ, et al. Moving forward with backward compatibility: translating wrist accelerometer data. Med Sci Sports Exerc 2016;48(11):2142–2149. doi: 10.1249/MSS.0000000000001015. [DOI] [PubMed] [Google Scholar]
- 21.Bakrania K, Yates T, Rowlands AV, Esliger DW, Bunnewell S, Sanders J, Davies M, Khunti K, Edwardson CL. Intensity thresholds on raw acceleration data: Euclidean Norm Minus One (ENMO) and mean amplitude deviation (MAD) approaches. PLoS ONE 2016;11(10):e016045. doi: 10.1371/journal.pone.0164045. [DOI] [PMC free article] [PubMed] [Google Scholar]
- 22.Hildebrand M, Van Hees VT, Hansen BH, Ekelund U. Age Group Comparability of Raw Accelerometer Output from Wrist- and Hip-Worn Monitors. Med Sci Sports Exerc 2014;46(9):1816–1824. [DOI] [PubMed] [Google Scholar]
- 23.Ramsay R, Hooker G, Graves S. Functional data analysis with R and MATLAB New York, NY: Springer; 2009. [Google Scholar]
- 24.Vladutiu CJ, Evenson KR, Borodulin K, Deng Y, Dole N. The association between physical activity and maternal sleep during the postpartum period. Matern Child Health J 2014;18(9):2106–2114. doi: 10.1007/s10995-014-1458-3. [DOI] [PMC free article] [PubMed] [Google Scholar]
- 25.Semplonius T, Willoughby T. Long-Term Links between Physical Activity and Sleep Quality. Med Sci Sports Exerc 2018;50(12):2418–2424. doi: 10.1249/MSS.0000000000001706. [DOI] [PubMed] [Google Scholar]
- 26.Mitchell JA , Godbole S, Moran K. No evidence of reciprocal associations between daily sleep and physical activity. Med Sci Sports Exerc 2016;48(10):1950–1956. doi: 10.1249/MSS.0000000000001000. [DOI] [PMC free article] [PubMed] [Google Scholar]
- 27.Štefan L, Sporiš G, Krističević T. The associations between sleep duration and sleep quality with self-rated health in young adults: a population-based study. Int J Adolesc Med Health 2018. doi: 10.1515/ijamh-2018-0007. [DOI] [PubMed] [Google Scholar]
- 28.Silva-Costa A, Griep RH, Rotenberg L. Associations of a short sleep duration, insufficient sleep, and insomnia with self-rated health among nurses. PLoS One 2015;10(5):e0126844. doi: 10.1371/journal.pone.0126844. eCollection 2015. [DOI] [PMC free article] [PubMed] [Google Scholar]
- 29.Facco FL, Grobman WA, Reid KJ, et al. Objectively measured short sleep duration and later sleeping midpoint in pregnancy are associated with a higher risk of gestational diabetes. Am J Obstet Gynecol 2017;217(4):447, e1–447.e13. doi: 10.1016/j.ajog.2017.05.066. [DOI] [PMC free article] [PubMed] [Google Scholar]