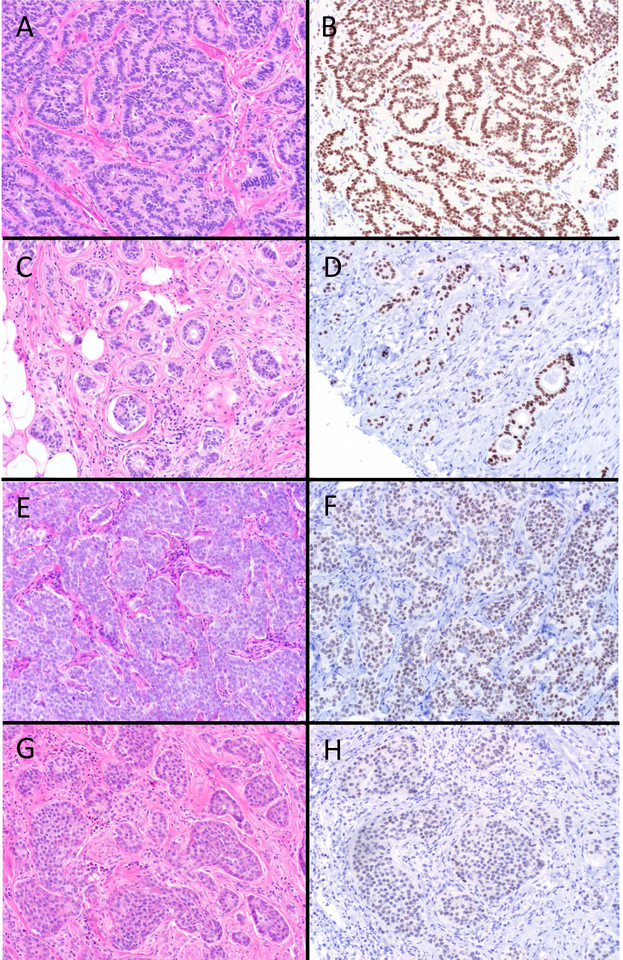
Figure 1.
SATB2 Expression in Rectal and Appendiceal Neuroendocrine Tumors (NETs). The vast majority of rectal NETs (A) demonstrated diffuse, strong SATB2 expression (B). While most appendiceal NETs were also SATB2-positive, they showed a greater range of expression. This tubular carcinoid (C) displays diffuse, strong staining (D), this EC-cell tumor (E) shows only slightly weaker staining (F), while this second EC-cell tumor (G) demonstrates more modest staining (H) (original magnification of each image 200x).

