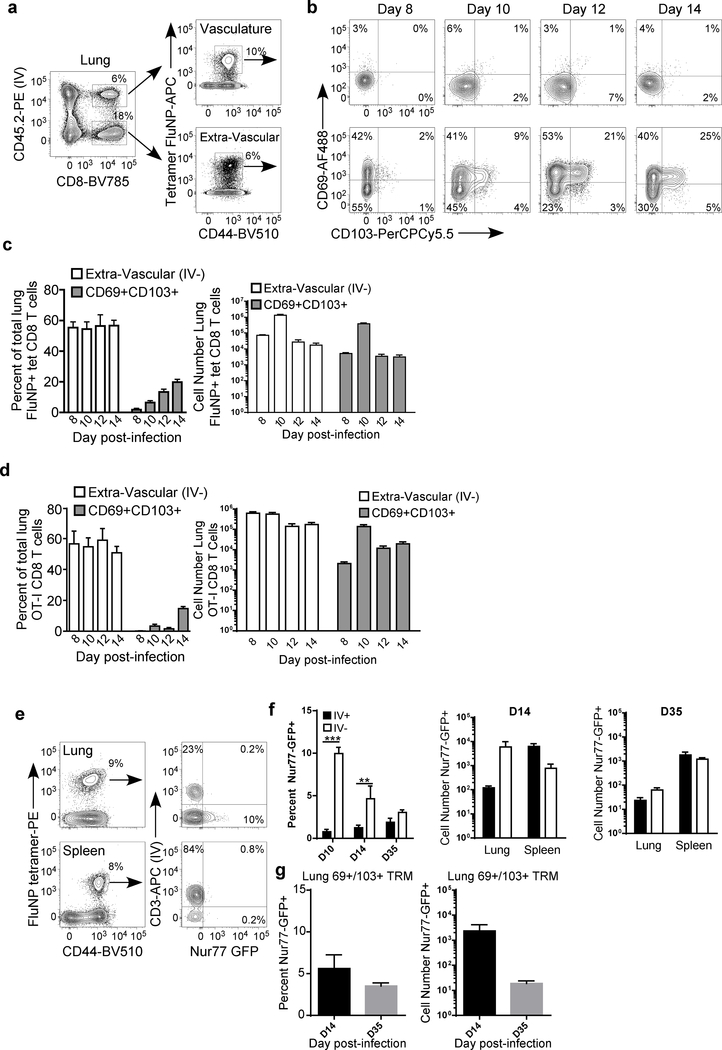
Figure 1. Rapid appearance of lung resident CD8 T cells following influenza infection.
(A) Gating strategy and representative flow plots for the intravital labeling of FluNP-specific CD8 T cells in the lung. (B) Representative flow plots for CD69 and CD103 staining on FluNP-specific CD8 T cells in the lung vasculature (top row) or lung extra-vascular compartments (bottom row). (C) Frequency and number of total extra-vascular FluNP-specific CD8 T cells and CD69+ CD103+ resident FluNP-specific CD8 T cells among total lung FluNP-specific CD8 T cells over time. (D) Frequency and number of total extra-vascular OT-I CD8 T cells and CD69+ CD103+ resident OT-I CD8 T cells among total lung OT-I CD8 T cells over time. (E) Representative staining of Nur77-GFP expression in FluNP-specific CD8 T cells. (F) Frequency and number of Nur77-GFP+ FluNP-specific CD8 T cells that are circulating (IV+) or extra-vascular (IV−) in the lung and spleen on days 10, 14, and 35 post-infection. (G) Frequency and number of Nur77-GFP+ FluNP-specific tissue-resident CD8 T cells expressing both CD69 and CD103 in the lung extra-vascular population. *** p<0.001 (two-tailed Student’s t-test) All graphs error bars are S.E.M. Data are representative of 3 independent experiments with 5 mice per time point (A-C and G) or 2 independent experiments with 4 mice each (E and F).

