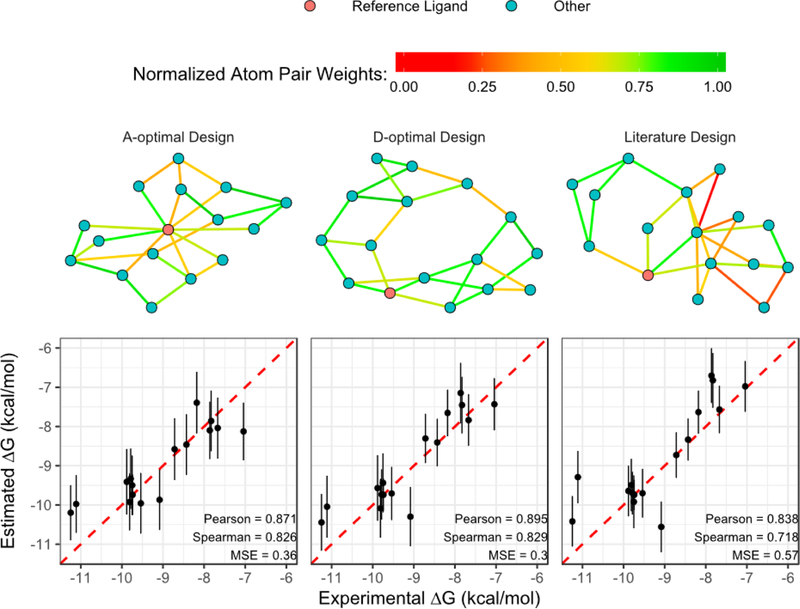
Figure 5:
Designs and FEP calculation results of the CDK2 ligand set from reference 2222. Top row is the visualization of weighted A-optimal, weighted D-optimal and literature designs. Ligand 1oi9 is selected as the reference and colored in red for illustration purpose. Each edge is colored with normalized AtomPair Fingerprint Tanimoto score of the connecting ligands. All the designs have the same reference ligand and the same number of pairs. Bottom row are the plots of ∆GExp vs. estimated from different designs. The error bar indicates one standard error based on least square fitting. The list of pairs in each design and their FEP calculation results are available in the SI table.

