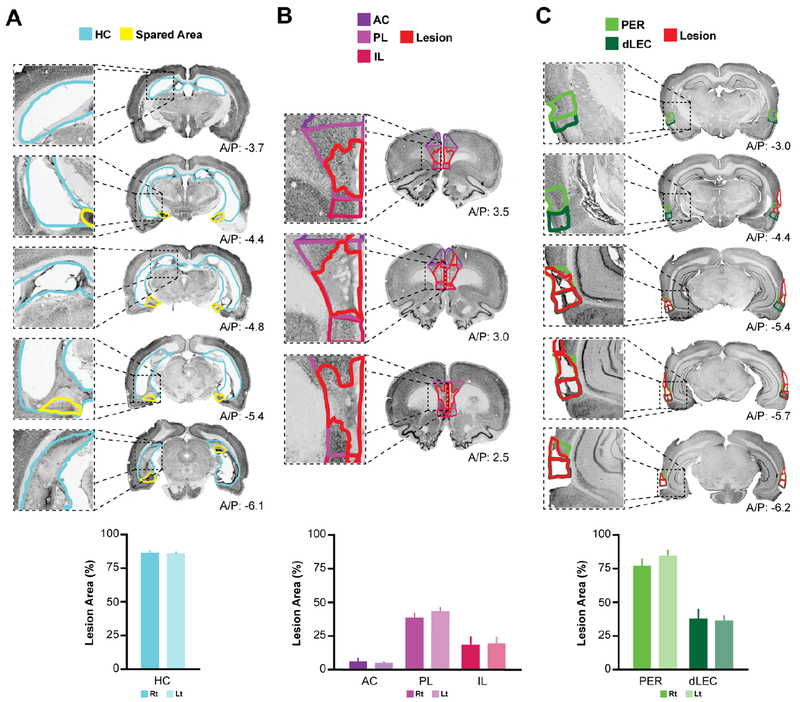
Figure 3. HC, PFC, and PER lesions.
Neurotoxic lesions were made using multiple localized injections of NMDA, which resulted in selective cell loss and atrophy. Slices were stained for NeuN and the percent lesion area was calculated for each region of interest. A, Sample slices from a representative HC lesioned subject (top), and mean lesion area percentage across subjects (bottom; n = 11). B, Sample slices from PFC lesioned subject including all subregions analyzed (AC, PL, and IL), and the mean lesion area percentage across subjects (n = 12). C, Sample slices from a PER lesioned subject and lesion area percentage across subjects (n = 12) in PER (A/P −4.0 to −7.2), and dorsal lateral entorhinal cortex (dLEC).

