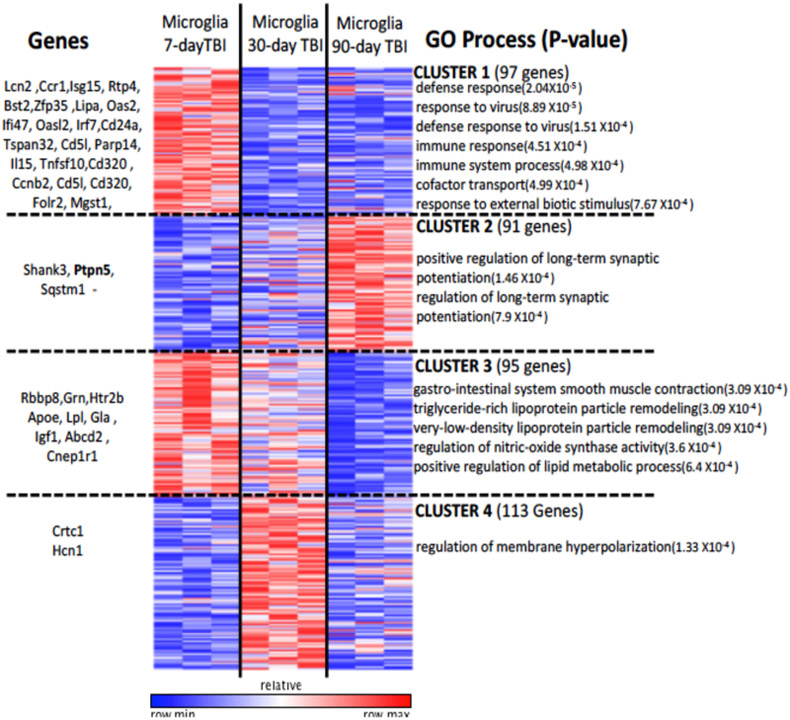
Figure 2:

Microglia from TBI mice show distinct time-dependent transcriptional profiles. K-means clustering (k=4): Four clusters representing 396 genes are shown with distinct time-specific expression patterns. Example genes from each cluster (left) and significant GO processes (right) are shown.
