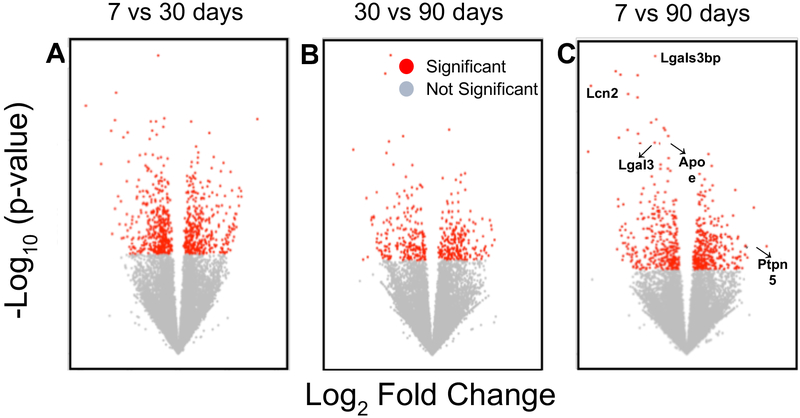
Figure 3:

Differentially expressed genes over the time course of injury. Volcano plots of differentially expressed genes in microglia (n=9) between 7D and 30D post-TBI (A), 30D and 90D post-TBI (B), and 7D and 90D post-TBI (C). Examples of genes with a p-value <0.05 (as calculated by DEseq model) are shown in red.
