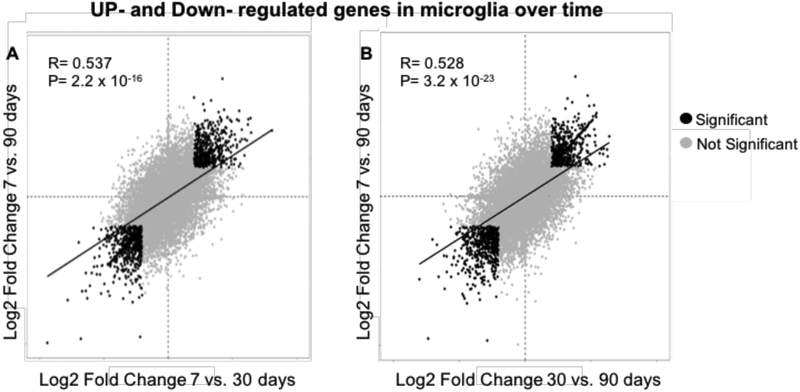
Figure 4:

Correlational analysis of change in gene expression microglia over time after TBI.
Scatter plot to examine the relationship between the genes that are up-regulated or down-regulated in the microglia of mice at A) 7 vs 30 days post-TBI compared to 7 vs 90 days post-TBI and at B) 30 vs 90 days post-TBI compared to 7 vs 90 days. A log2 fold change of 1 is equal to a 2-fold change between time point mean expression (indicated in black dots) (n=9).
