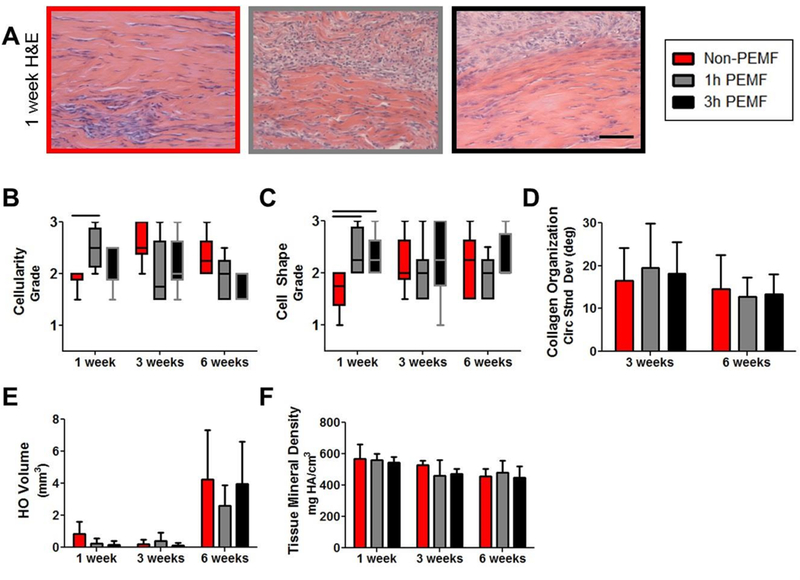
Figure 4. Complete tear with immobilization histological and μCT properties.

(A) Representative images of the injury site 1 week post-injury. (B) Cellularity was increased for the 1 hour PEMF group at 1 week post-injury, and (C) cells were more rounded in both PEMF groups compared to controls. (D) No differences were seen in collagen alignment. μCT imaging showed no differences between groups with regards to (E) volume or (F) mineral density of heterotopic ossification at any time point. Data in B and C presented as median ± IQR with minimum and maximum whiskers. Data in D-F presented as mean + SD. Scale bar in A: 100 um. Solid bars indicate significant differences (p<0.025).
