Abstract
Probing molecular properties in the gas phase requires the integration of complementary ion manipulation approaches such as ion mobility spectrometry. Structures for lossless ion manipulations (SLIM) has recently been developed to perform ultra-high resolution ion mobility separations using traveling waves as well as provide other advanced capabilities. Despite its success, the design aspects of SLIM have not been fully explored and remained largely unchanged. Here, we report on a computational study using SIMION simulations of a number of traveling wave (TW) patterns that can be used in SLIM. The TW pattern used in the current SLIM device is a set of 8 electrodes where, at any time, 4 electrodes are held at high voltage (i.e. 1111) while the other 4 electrodes are held at low voltage (i.e. 0000), forming one micro-trapping region of 11110000 pattern. Ion trajectory simulations demonstrated the feasibility to simplify the 8-electrode set to a shorter pattern (e.g. 6-electrode or 4-electrode set) while maintaining or improving the performance. The RF and TW amplitude, guard voltage, and TW speed were optimized subsequently on the symmetric patterns of the 4-, 6-, and 8-electrode sets to further improve the performance. The resolution, peak broadening, peak capacity, and peak generation rate of each pattern were evaluated, showing that the 111000 pattern of the 6-electrode set has comparable performance as the current 11110000 pattern, and is always better than the 1100 pattern. This work provides insight and feasibility for simplification and modification of TW configuration in SLIM and other traveling wave devices.
Keywords: Traveling wave patterns, Ion trajectory simulations, ion mobility, resolution, peak broadening, peak capacity, peak generation rate
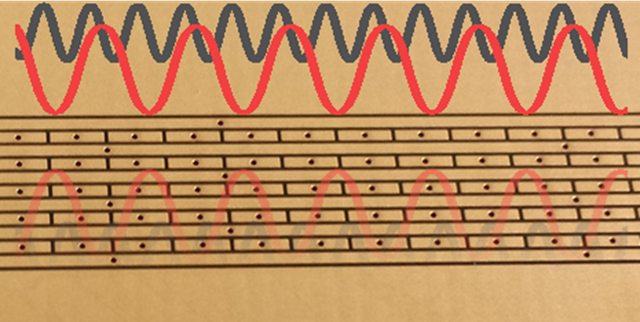
Graphical Abstract
Introduction
Ion mobility (IM) coupled to mass spectrometry (MS) is a powerful technique for analytical separations, detection, and structural characterization by measuring collision cross sections (CCS) and mass-to-charge (m/z) ratio1–6. IM-MS has been widely used for the analysis of a broad range of analytes including chemical warfare agents6, volatile organic compounds7, drugs8, and biomolecules9. Many types of IM have been developed in the past decades, including drift tube ion mobility spectrometry (DTIMS)10, high field asymmetric ion mobility spectrometry (FAIMS)11, differential ion mobility spectrometry (DMS)12, trapped ion mobility spectrometry (TIMS)13 and traveling-wave ion mobility spectrometry (TWIMS)14. A DTIMS is the traditional type of IM where ions are separated according to their collision cross sections with a buffer gas under the influence of a homogeneous electric field. The DTIMS separation power is directly correlated to the length of the drift tube and the electrical field applied. Owing to diffusional broadening, the ability to resolve two peaks using DTIMS can be obtained from the diffusion-limited resolving power equation , where q is the ion charge, E is the applied constant electric field, L is the length of the drift tube, kB is the Boltzmann constant, and T is the temperature. The performance of DTIMS is limited by the maximum electric field that can be applied (typically few kV) and geometry constraints imposed by the linear drift tube length (more than 2 m length becomes cumbersome and impractical). This effectively limits the maximal achievable resolving power from DTIMS instruments. Unlike DTIMS, which requires a fixed high voltage, TWIMS uses a low amplitude traveling wave (TW) to create a dynamic field to drive and separate ions. Ions with higher mobility can keep up with TW than lower mobility ions that tend to fall behind by the passing wave. This form of ion separation enables the use of a fixed voltage without the debilitating limitation of high voltage drops associated with DTIMS. When the TW approach is coupled to a flexible ion path design (e.g. serpentine path), enabled by Structures for Lossless Ion Manipulations (SLIM), there is potential for ultra-long path length separations. SLIM15 use two planar surfaces patterned with arrays of electrodes that are supplied with RF, DC, and TW potentials to confine and drive ions in gases at a pressure of few Torr. The electrode arrays can be patterned on printed circuit boards (PCBs) at low cost and are easily fabricated. The ability to pattern such electrodes on surfaces enables complex ion manipulations such as turning around a corner16, switching ions to orthogonal path17, and moving ions between levels using elevators and escalators18. These manipulations enable extremely long path length and ultra-high resolution ion mobility separations through multi-pass operations15, 19. The serpentine path design and multi-pass operation have been demonstrated for ultra-high resolution with more than 500 m ion path length, indicating the SLIM ability to achieve high resolution IM separation15.
SLIM instruments built thus far have involved high resolution instrumentation targeted for biological analysis. The nominal path length was 13 m with the ability for multi-pass. The TW patterns applied used 8 electrodes with wave profile that were 45° phase-shifted to create a TW based IM separation. However, the performance of TW created with different number of electrode sets to create a TW was not investigated. One of the most effective ways to influence the performance of SLIM is to optimize the TW configuration. TW configuration is defined as the number of TW electrodes in a set while the TW pattern is the number of electrodes held at high and low voltage. The current SLIM design has 8 electrodes forming a single TW configuration which is repeated throughout the entire path length. In the 8-electrode set, 4 consecutive electrodes are held at high potential while the remaining 4 electrodes are held at low potential (i.e. a pattern of 11110000, where 1 represents an electrode with high potential and 0 an electrode with a low potential). The TW is created when the pattern is stepped through the 8 electrodes one electrode at a time. However, this configuration requires a power supply with 8 separate channels. If the TW configuration can be reduced to less than 8 electrodes, power supply requirements can be reduced, SLIM can be simplified, and tighter corners can be designed. These features enable the construction of a longer path length SLIM in a smaller footprint and provide the basis for a small and portable SLIM device. Previously published work from our group compared the mobility resolution for different patterns of the 8-electrode set and indicated that the current pattern of 11110000 is optimum20. Other work has also demonstrated that a 4 repeat pattern of 8 TW configuration has 20% increased field strength in Synapt G2 IM-MS instrument compared to the 6 repeat pattern of 8 TW configuration in the Synapt G1 IM-MS3, 21.
The investigation of different traveling wave configurations and patterns would enable designing simpler waveforms with similar or better peak characteristics. For instance, the nature of the serpentine path separation in SLIM requires ions to turn around corners. While straight motion of ions entails some diffusional broadening, turning around corners has to be accomplished with minimization of “race track” effects which could lead to a reduced separation performance. This is typically overcome in SLIM by making sharp 90° turns. This is accomplished by intersecting ions traversing a path with an orthogonally moving wave. Precise alignment of the TW electrodes is required to maintain wave continuity at the turn, which is simpler if there is flexibility in the TW configuration.
The efforts in SLIM development so-far have not examined a more diverse range of TW electrodes, simpler patterns, or smaller number of electrodes. Here, we perform an ion simulation study to explore the feasibility of simplifying the TW configuration and its effect on the peak properties. We demonstrate that other TW configurations can be used without loss of resolution via optimizing the operating parameters. The resolution trends on different TW patterns are calculated to investigate the impact of the TW patterns. Other operating parameters including RF and TW amplitude, guard voltage, and TW speed of 6- and 4-electrode sets were optimized. The resolution of different TW patterns has been demonstrated to be enhanced and comparable to the currently used 11110000 pattern. This work provides insight into the feasibility of simplifying and modifying the TW configuration in SLIM and other traveling wave devices while maintaining or improving the performance.
Methods
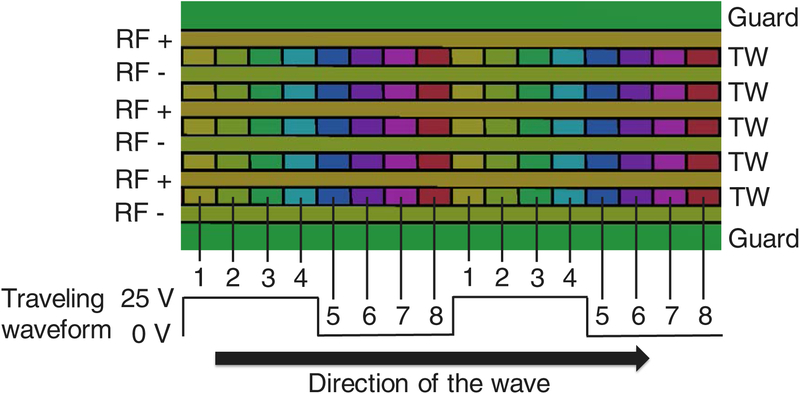
Ion motion and optimizations of the SLIM array design were simulated using SIMION 8.1 (Scientific Instrument Services Inc., Ringoes, NJ, USA) incorporated with statistical diffusion simulation (SDS)22 collision model for ions drifting in 4 Torr nitrogen gas. The electrode geometries were generated based on the current design of SLIM device. User programs were imported to operate the simulation via controlling the ion-neutral collision, voltage and frequency variation for ion confinement and separation in the created electric field. All ions were created at an initial condition of 0.1 eV kinetic energy with a Gaussian 3-dimensional distribution at the center of the TW microtrap. The SLIM design for the 8-electrode set is shown in Figure 1. In this design, an independent voltage is applied to each of the 8 electrodes. Two mirror-image planar surfaces are arranged in parallel at a spacing of 3 mm. The model consists of 6 RF strips interleaved with 5 arrays of TW electrodes with a 0.1 mm electrode gap between the electrodes. The length, width, and thickness of each TW electrode are 1 mm, 0.5 mm and 0.5 mm, respectively. The width and thickness of each RF electrode are 0.5 and 0.5 mm, respectively. There are two “guard” strip electrodes with a width of 1 mm adjacent to the two outer RF electrodes, supplied with a DC voltage for ion confinement in the lateral direction. Each RF electrode is supplied with the same amplitude but 180° out-of-phase sinusoidal waveform between each adjacent RF electrode to generate a pseudopotential for ion confinement between the two SLIM surfaces. A DC potential applied on each TW electrode varies from 0 to the assigned amplitude. The TW is stepped one electrode at a time with a constant speed.
Figure 1.
The current SLIM design of an 8-electrode set using 11110000 pattern
Results and Discussion
1. TW patterns comparison
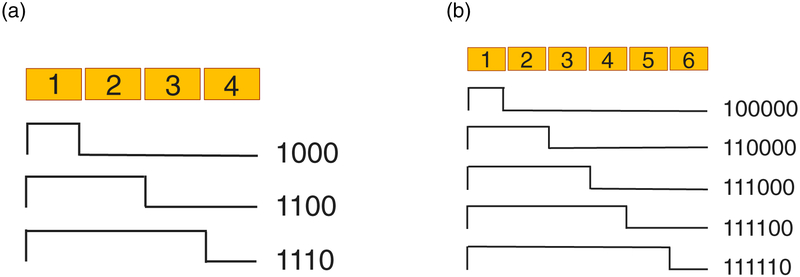
The effect of different TW patterns on the IM resolution of different TW sets of 4-, 6-, 8-, and 12-electrode sets were evaluated. An example of the simulated patterns of 4- and 6-electrode sets are shown in Figure 2. Singly charged phosphazine ions of m/z 622 and 922 from Agilent tuning mixture were simulated for a path length of 1320 mm (except when noted). Optimum guard electrodes voltage (15 V), RF (1 MHz, 350 Vp-p), and TW (92 m/s, 25 V0-p) conditions were chosen for 100% ion transmission.
Figure 2.
Potential TW patterns for 4- and 6-electrode sets.
The mean arrival time and its standard deviation for the ions that transverse the full path was recorded. The resolution of m/z 622 and 922 ions was calculated using equation 1:
| (1) |
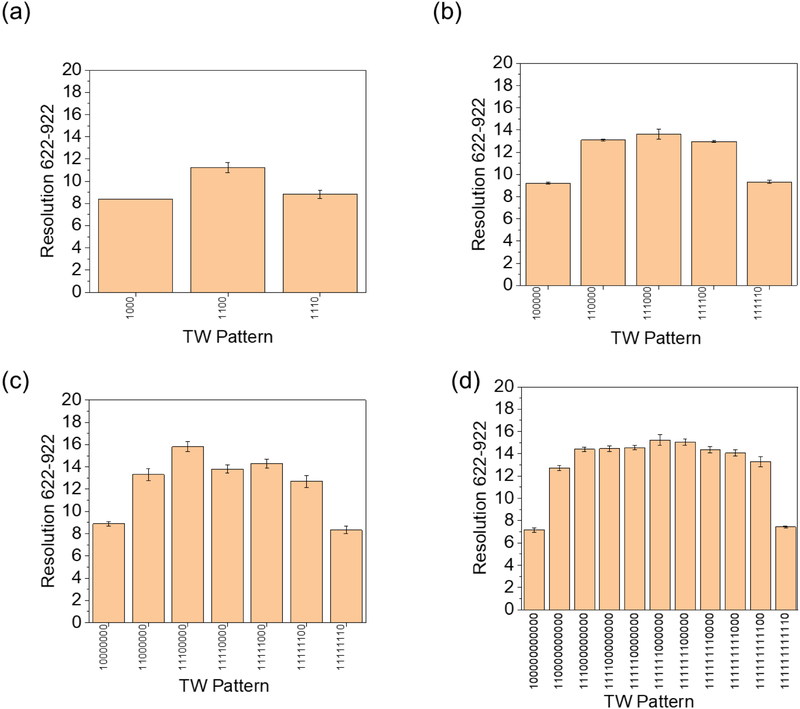
where t622 and t922 are the arrival times of m/z 622 and 922 ions measured at the apex of the peak and Δt622 and Δt922 are the full widths at half-maximum (FWHM) of m/z 622 and 922 peaks, respectively. As shown in Figure 3, the resolution of each TW set is the highest when TW patterns are symmetric. This is because asymmetric patterns generate a low potential wall of TW to move ions forward (i.e. ions are easily rolling over). Another consequence of asymmetric waves is a longer field-free region. For example, 10000000 pattern results in a large portion of the wave form at the same voltage leading to a long field-free region where ions execute diffusional broadening for much longer time. Thus the two extremes of asymmetric wave patterns (for example 10000000 and 11111110) will cause longer separation times and more ion diffusion with relatively low resolution and more peak broadening effect as compared to symmetric or near symmetric wave forms.
Figure 3.
Resolution of each pattern of different TW electrode sets (3 replicate runs for each). (a) 4-electrode set; (b) 6-electrode set; (c) 8-electrode set; (d) 12-electrode set.
As shown in Figure 3, the ion mobility resolution of the symmetric of 6-, 8-, and 12-electrode sets are close, which is promising for using a lower number of TW electrodes. The resolution of 1100 pattern is ~20% lower than the other symmetric patterns which can be further optimized and improved. However, the 11100000 and 11111000 patterns show similar (within error bars) resolution compared to that of the 11110000 pattern. The error bars were calculated from the results of three replicates. The variations in the simulation arise from the computation of collisional statistics by the SDS model, wherein the variance in the arrival time distribution decreases with increased ion populations at the cost of increased computational time.
2. Ion mobility resolution optimization
Many parameters affect the IM performance in SLIM, especially the RF and TW amplitude which can impact the ion motion and TW separations. In this work, the amplitude of RF and TW, guard voltage, and TW speed were optimized for optimum resolution. Peak capacity and peak broadening effects were also compared before and after the optimization.
The RF potentials are utilized in SLIM to confine ions between the two surfaces. When the RF amplitude is not sufficiently high, ions are not effectively confined, especially ions with high m/z. TW is used to separate and move ions along the axial direction. When the TW amplitude is too high, microtraps are formed where ions are pushed forward by the TW voltage “wall”, causing ions to move at the same speed as the TW, termed “surfing”. However, if the TW amplitude is too low, the ion drift velocity is low and the moving wave frequently overtakes the ions, resulting in more rollover events. This causes the effective flight time of ions within the SLIM device to increase, leading to increased peak broadening.
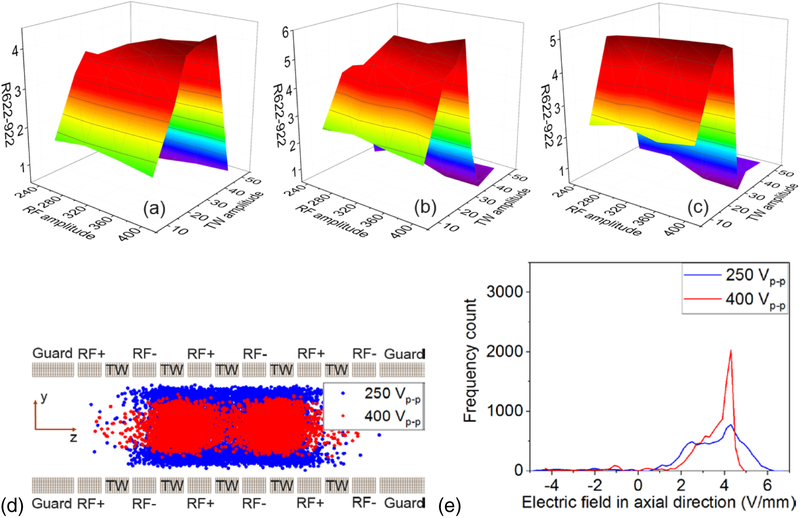
The RF and TW amplitude (for TW patterns of 1100, 111000 and 1111000) were optimized by calculating the resolution for a range of RF and TW amplitudes. The RF amplitude was ramped from 250 Vp-p (in 50 V steps) to reach a practical voltage limit of 400 Vp-p (onset of electrical breakdown in our current setup), while the TW amplitudes of 10, 20, 25, 30, 35, 40, and 50 V were used. A total of 100 ions of each of m/z 622 and 922 was utilized in a path length of 152 mm. A longer path length of 1320 mm (as used in other simulations here) and a larger number of ions was unrealistic in this case owing to extremely long computation time and the large number of simulations conducted. Therefore, while the trends of computed resolutions should be similar, the absolute values are lower compared to results in Figure 3. As shown in Figure 4a–c, the optimal RF amplitude is ~400 Vp-p for all the TW patterns, and the optimal TW amplitude for 1100, 111000, and 11110000 are 40 V, 30 V, and 25 V, respectively. The resolution increased slightly for all the TW patterns with the increase in RF amplitude. A higher RF amplitude results in a better confinement and reduced electric field variation causing a slightly higher resolution. This was demonstrated by comparing the electric field of ion plume at two different RF amplitudes 250 Vp-p and 400 Vp-p with the same TW amplitude (30 V) using 111000 TW pattern. Figure 4d shows a cross section view of SLIM where a tighter ion plume is observed at higher RF amplitude. Figure 4e shows the TW electric field distribution an ion experiences moving in axial-x dimension (i.e. the direction of ion motion). The results indicate that at higher RF amplitudes, ions experience a tighter TW electric field distribution, which provides less deviation in ion speed and less peak broadening, allowing higher resolution to be achieved than with lower RF amplitude.
Figure 4.
Optimization of RF amplitude and TW voltage. (a) 1100 TW pattern; (b) 111000 TW pattern; (c) 1111000 TW pattern. Electric field comparison using two different RF amplitude (250 Vp-p and 400 Vp-p) (d) cross section view of SLIM and ion plume confinement distribution of 10000 ions; (e) distribution of TW electric field in axial-x dimension as experienced by an ion.
After the critical parameters have been optimized, guard voltage was optimized to investigate its impact on resolution. Guard voltage is a low DC voltage that is used to constrain the ions along the two sides of the ion path in the lateral direction (i.e. perpendicular to ion motion). If the guard voltage is too low, ions are not efficiently constrained, leading to ion leaking from the two sides. If the guard voltage is too high, there may be a field penetration from the guard electrode sides to the electric field at the ion trapping center, causing a field distortion at the trapping region.
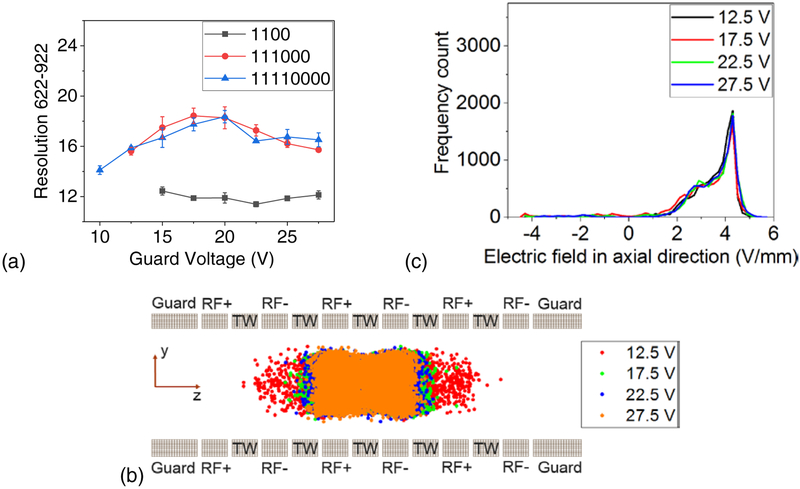
An RF amplitude of 400 Vp-p was used for all of the TW patterns, and the optimized TW amplitude 40 V, 30 V, and 25 V were applied for 1100, 111000 and 11110000 TW patterns, respectively. Figure 5a shows the resolution trends of m/z 622 and 922 ions at the different guard voltages. The optimal guard voltage is 15 V, 17.5 V and 20 V for the 1100, 111000 and 11110000 TW patterns, respectively. The resolution was not calculated at lower voltages since the guard voltage was too low to prevent ion losses. The resolution trends indicate a slight impact of guard voltage on the resolution change, which is somewhat negligible in the resolution optimization.
Figure 5.
(a) Guard voltage optimization of 1100, 111000 and 11110000 TW patterns. (b) Plume confinement distribution of 10000 ions; (c) Variation of TW electric field in axial-x dimension for 111000 pattern.
To better understand the small effect of guard voltage, the ion plume distribution was plotted at 4 different guard voltages (12.5 V, 17.5 V, 22.5 V, and 27.5 V) using the same RF amplitude (400 Vp-p), TW amplitude (30 V), and 111000 pattern. Figure 5b shows the ion plume distribution in the yz plane, presenting a more laterally-constrained ion plume at higher guard voltages. Figure 5c shows similar TW electric field profiles in the axial-x dimension at different guard voltages, which confirms the negligible effect of guard voltage on the resolution. Similar results were obtained at an RF amplitude of 250 Vp-p (Supplementary information Figure 1) but with a wider ion plume distribution due to the weaker RF field. Overall, these results indicate that the guard voltage does not significantly affect the RF or TW electric field but slightly affects the ion confinement in the lateral direction.
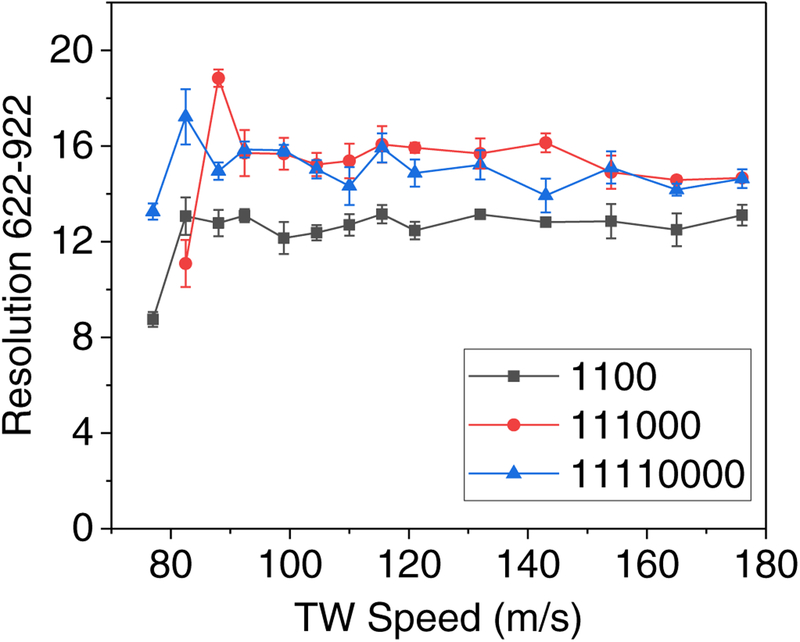
TW speed was optimized as another parameter to improve IM resolution for each TW pattern at their optimal RF and TW amplitudes. As shown in Figure 6, the observed trend of the TW speed on the resolution is similar to previous experimental findings and theoretical predictions15, 20, 23. When the TW speed is too low (or ions’ mobility is sufficiently high), ions will surf and no separation will occur. When the TW speed is increased, m/z 622 ions with higher mobility move at the same velocity as the traveling wave without rolling over, while m/z 922 ions with lower mobility roll over and begin to separate. The optimal resolution for a specific m/z is obtained at the TW speed where ion motion transitions from surfing to separation mode. When the TW speed is increased further, the resolution shows a decreasing trend to a plateau. At this high TW speed range, rolling over commonly occurs, which does not significantly change the resolution as shown in Figure 6. The optimal TW speed of 1100, 111000 and 11110000 TW patterns is 82 m/s, 88 m/s and 82 m/s, respectively.
Figure 6.
TW speed optimization of 1100, 111000 and 11110000 TW patterns.
3. Performance evaluation
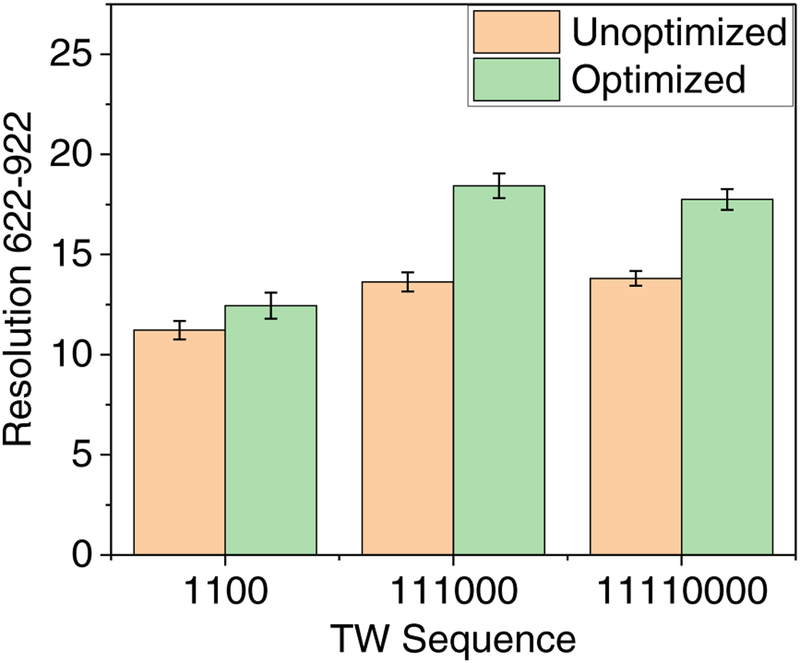
The resolution between m/z 622 and 922 ions was compared before and after the optimization. In the unoptimized setting, the resolution of 111000 pattern is comparable to 11110000 pattern, and higher than 1100 pattern (Figure 7). Optimization of the RF, TW, and guard potentials resulted in resolution improvements of 11%, 35% and 33% for the 1100, 111000 and 11110000 patterns, respectively. Additionally, the resolution of 111000 shows similar improvement like that of the 11110000 pattern, and is always better than the 1100 pattern.
Figure 7.
Resolution comparison of 1100, 111000 and 11110000 TW patterns before and after the optimization.
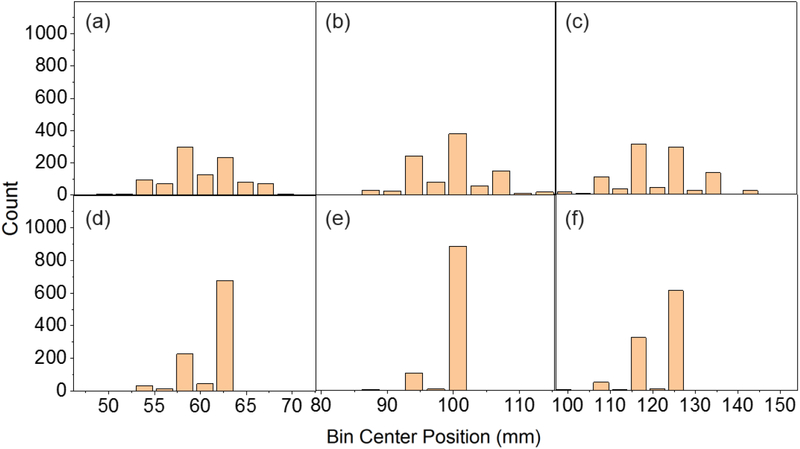
The improvement of resolution can be also inferred from understanding the spatial distribution of ions across the TW bins. Ions experiencing a large number of rolling over events tend to spread across a large number of TW bins and vice versa. To only understand the impact of rolling over events, we fixed the number of TW bins to 14 for 1100, 111000, and 11110000 patterns. 1000 ions were allowed to fly the entire 14 bins for each configuration. Shown in Figure 8 a–f is the spatial distribution of ions after traversing the 14 TW bins before and after the optimization. It is clear the spatial distribution of ions for all three patterns studied is much narrower after optimization.
Figure 8.
Ion distributions histograms recorded for unoptimized (top) and optimized (bottom) wave patterns of (a) 1100 (b) 111000 (c) 11110000.
Device performance is commonly evaluated by resolution, which gives information about how well two charged species can be separated according to their mobility. Other metrics such as peak capacity are also useful in the performance evaluation for TWIMS. Peak capacity is a dimensionless measurement representing the maximum number of peaks that can be resolved in a single separation. Peak capacity can be calculated using equation 224, 25:
| (2) |
where t1822 and t622 represent the arrival times of m/z 1822 and 622 ions (range of ions studied here), and (Δt)average is the average full width at half maximum of m/z 622, 922, 1222, 1522 and 1822 phosphazine ions. Table 1 shows the peak capacity of 1100, 111000, and 11110000 patterns measured before and after the optimization. Although no improvement in peak capacity was observed for the 1100 pattern, the 111000 pattern dropped by ~6% while the 11110000 pattern improved by ~20%. Regardless, the 111000 pattern resulted in a similar performance to the 11110000 pattern. This result indicates that the 111000 pattern can generate comparable peak capacity to the 11110000 pattern.
Table 1.
The peak capacity of 1100, 111000, and 11110000 TW pattern measured before and after the optimization
| TW pattern | Peak capacity (unoptimized) | Peak capacity (optimized) | Improvement % |
|---|---|---|---|
| 1100 | 30 | 30 | 0 |
| 111000 | 46 | 43 | −6 |
| 11110000 | 37 | 45 | 22% |
Peak generation rate is another figure of merit calculated as the ratio of the peak capacity to the range of the separation time, shown by equation 320, 26:
| (3) |
We estimated the peak generation rate of each TW pattern before and after the optimization (Table 2). Before the optimization, the measured peak generation rates of 1100, 111000, and 11110000 TW pattern were 258 s−1, 402 s−1, and 527 s−1, respectively. The 11110000 pattern shows a higher peak generation rate than the other patterns, while after optimizing the parameters, the peak generation rate of 1100 and 111000 has been significantly improved by 120–200 %, showing a much higher improvement than the 11% of the 11110000 pattern. The highest peak generation rate among the three TW patterns is 910 s−1 for the 111000 pattern, which is 55 % higher than that of the 11110000 pattern, and approximately 3 orders of magnitude greater than those in condensed phases (e.g., The average peak generation rate of liquid chromatography is ~0.1−1.2 s−1) due to the fast speeds of gas-phase ions25, 27. However, ion mobility separation is pos-tionization technique while liquid chromatography is pre-ionization technique and their integration is beneficial for maximum separation power. This result indicates a high peak generation rate can be achieved from the 111000 pattern than the 1100 and 11110000 patterns after the optimization. This increase in peak generation rate will maximize the separation power of SLIM when integrated with other separation approaches such liquid chromatography.
Table 2.
The peak generation rate of 1100, 111000, and 11110000 TW patterns measured before and after the optimization
| TW pattern | Peak generation rate (before) | Peak generation rate (after) | Improvement % |
|---|---|---|---|
| 1100 | 258 s−1 | 775 s−1 | 200 % |
| 111000 | 402 s−1 | 910 s−1 | 126 % |
| 11110000 | 527 s−1 | 587 s−1 | 11 % |
Conclusion
SLIM utilizes the traveling wave to perform ultra-high resolution ion mobility separations. RF and DC guard voltages are used in SLIM for efficient ion confinement with lossless ion transmission. In this work, the effect of TW patterns on the resolution was studied for different TW configurations. In addition to the currently utilized 11110000 pattern shorter patterns (1100 and 111000) were also investigated. It was observed that the symmetric patterns, in general, provided the highest resolution. Operational parameters such as RF and TW amplitude, guard voltage, and TW speed were then optimized subsequently for the 1100, 111000 and 11110000 TW patterns to further enhance the resolution. The resolution was compared before and after the optimization, showing an improvement of 11%, 35% and 33% for the 1100, 111000 and 11110000 TW patterns, respectively. The resolution of 111000 is comparable to 11110000 before and after the optimization, and higher than the resolution of 1100 pattern. The spatial ion distribution for each TW pattern was simulated to understand the effect of ions rollover which can cause peak broadening. Upon optimizing the resolution, the spatial distribution of ions narrowed than before optimization which translates to a tighter ion packet. Peak capacities and peak generation rates were estimated before and after the optimization as well. The peak capacity of 111000 pattern is comparable to 11110000 pattern and higher than 1100 pattern before and after the optimization. The peak generation rate of 111000 is significantly increased after the optimization by 17% and 55% higher than 1100 and 11110000 pattern, respectively. The peak capacity and peak generation rate comparison indicates that the improvement trend is not following the same trend of resolution change, but 111000 always shows comparable or better results than 11110000. The performance evaluation of resolution, ion distribution, and peak capacities and peak generation rates demonstrated that the 111000 pattern has the ability to provide comparable performance as the current 11110000 pattern. Additionally, the 111000 pattern always shows higher performance than 1100 pattern, implying the 111000 pattern would be a better candidate for SLIM simplification than 1100 pattern. On the other hand, the 1100 pattern requires fewer channels (and smaller power supply to operate), has higher peak generation rate than the 11110000 patern, and the resolution can be comparable to the other patterns by doubling the path length. This would be a promising step and insight for the simplification of SLIM and other traveling based devices.
Supplementary Material
Acknowledgment
The authors would like to thank Dr. Adam Hollerbach for his help with this manuscript. This research was supported by the National Cancer Institute (R33 CA217699) and the National Institute of General Medical Sciences of the NIH (R01 GM130709-01). Experiments were performed at the W. R. Wiley Environmental Molecular Sciences Laboratory (EMSL), a DOE national scientific user facility at the Pacific Northwest National Laboratory (PNNL). PNNL is operated by Battelle under contract DE-AC05-76RL0 1830 for the DOE.
References
- 1.Kliman M; May JC; McLean JA, Lipid analysis and lipidomics by structurally selective ion mobility-mass spectrometry. Biochim Biophys Acta 2011, 1811 (11), 935–45. [DOI] [PMC free article] [PubMed] [Google Scholar]
- 2.Lapthorn C; Pullen F; Chowdhry BZ, Ion mobility spectrometry-mass spectrometry (IMS-MS) of small molecules: separating and assigning structures to ions. Mass Spectrom Rev 2013, 32 (1), 43–71. [DOI] [PubMed] [Google Scholar]
- 3.Pringle SD; Giles K; Wildgoose JL; Williams JP; Slade SE; Thalassinos K; Bateman RH; Bowers MT; Scrivens JH, An investigation of the mobility separation of some peptide and protein ions using a new hybrid quadrupole/travelling wave IMS/oa-ToF instrument. International Journal of Mass Spectrometry 2007, 261 (1), 1–12. [Google Scholar]
- 4.Lanucara F; Holman SW; Gray CJ; Eyers CE, The power of ion mobility-mass spectrometry for structural characterization and the study of conformational dynamics. Nat Chem 2014, 6 (4), 281–94. [DOI] [PubMed] [Google Scholar]
- 5.Ruotolo BT; Benesch JL; Sandercock AM; Hyung SJ; Robinson CV, Ion mobility-mass spectrometry analysis of large protein complexes. Nat Protoc 2008, 3 (7), 1139–52. [DOI] [PubMed] [Google Scholar]
- 6.Steiner WE; Harden CS; Hong F; Klopsch SJ; Hill HH Jr.; McHugh VM, Detection of aqueous phase chemical warfare agent degradation products by negative mode ion mobility time-of-flight mass spectrometry [IM(tof)MS]. J Am Soc Mass Spectrom 2006, 17 (2), 241–5. [DOI] [PubMed] [Google Scholar]
- 7.Sabo M; Matejcik S, Corona discharge ion mobility spectrometry with orthogonal acceleration time of flight mass spectrometry for monitoring of volatile organic compounds. Anal Chem 2012, 84 (12), 5327–34. [DOI] [PubMed] [Google Scholar]
- 8.Williams JP; Scrivens JH, Coupling desorption electrospray ionisation and neutral desorption/extractive electrospray ionisation with a travelling-wave based ion mobility mass spectrometer for the analysis of drugs. Rapid Commun Mass Spectrom 2008, 22 (2), 187–96. [DOI] [PubMed] [Google Scholar]
- 9.May JC; Goodwin CR; Lareau NM; Leaptrot KL; Morris CB; Kurulugama RT; Mordehai A; Klein C; Barry W; Darland E; Overney G; Imatani K; Stafford GC; Fjeldsted JC; McLean JA, Conformational ordering of biomolecules in the gas phase: nitrogen collision cross sections measured on a prototype high resolution drift tube ion mobility-mass spectrometer. Anal Chem 2014, 86 (4), 2107–16. [DOI] [PMC free article] [PubMed] [Google Scholar]
- 10.Dugourd P; Hudgins RR; Clemmer DE; Jarrold MF, High-resolution ion mobility measurements. Review of Scientific Instruments 1997, 68 (2), 1122–1129. [Google Scholar]
- 11.Guevremont R, High-field asymmetric waveform ion mobility spectrometry: A new tool for mass spectrometry. Journal of Chromatography A 2004, 1058 (1–2), 3–19. [PubMed] [Google Scholar]
- 12.Kolakowski BM; Mester Z, Review of applications of high-field asymmetric waveform ion mobility spectrometry (FAIMS) and differential mobility spectrometry (DMS). Analyst 2007, 132 (9), 842–64. [DOI] [PubMed] [Google Scholar]
- 13.Michelmann K; Silveira JA; Ridgeway ME; Park MA, Fundamentals of trapped ion mobility spectrometry. J Am Soc Mass Spectrom 2015, 26 (1), 14–24. [DOI] [PubMed] [Google Scholar]
- 14.Shvartsburg AA; Smith RD, Fundamentals of Traveling Wave Ion Mobility Spectrometry. Analytical Chemistry 2008, 80 (24), 9689–9699. [DOI] [PMC free article] [PubMed] [Google Scholar]
- 15.Deng L; Ibrahim YM; Hamid AM; Garimella SVB; Webb IK; Zheng X; Prost SA; Sandoval JA; Norheim RV; Anderson GA; Tolmachev AV; Baker ES; Smith RD, Ultra-High Resolution Ion Mobility Separations Utilizing Traveling Waves in a 13 m Serpentine Path Length Structures for Lossless Ion Manipulations Module. Analytical Chemistry 2016, 88 (18), 8957–8964. [DOI] [PMC free article] [PubMed] [Google Scholar]
- 16.Garimella SV; Ibrahim YM; Webb IK; Ipsen AB; Chen TC; Tolmachev AV; Baker ES; Anderson GA; Smith RD, Ion manipulations in structures for lossless ion manipulations (SLIM): computational evaluation of a 90 degrees turn and a switch. Analyst 2015, 140 (20), 6845–52. [DOI] [PMC free article] [PubMed] [Google Scholar]
- 17.Chen T-C; Ibrahim YM; Webb IK; Garimella SVB; Zhang X; Hamid AM; Deng L; Karnesky WE; Prost SA; Sandoval JA; Norheim RV; Anderson GA; Tolmachev AV; Baker ES; Smith RD, Mobility-Selected Ion Trapping and Enrichment Using Structures for Lossless Ion Manipulations. Analytical Chemistry 2016, 88 (3), 1728–1733. [DOI] [PMC free article] [PubMed] [Google Scholar]
- 18.Ibrahim YM; Hamid AM; Cox JT; Garimella SVB; Smith RD, Ion Elevators and Escalators in Multilevel Structures for Lossless Ion Manipulations. Analytical Chemistry 2017, 89 (3), 1972–1977. [DOI] [PMC free article] [PubMed] [Google Scholar]
- 19.Deng L; Webb IK; Garimella SVB; Hamid AM; Zheng X; Norheim RV; Prost SA; Anderson GA; Sandoval JA; Baker ES; Ibrahim YM; Smith RD, Serpentine Ultralong Path with Extended Routing (SUPER) High Resolution Traveling Wave Ion Mobility-MS using Structures for Lossless Ion Manipulations. Analytical Chemistry 2017, 89 (8), 4628–4634. [DOI] [PMC free article] [PubMed] [Google Scholar]
- 20.Hamid AM; Ibrahim YM; Garimella SV; Webb IK; Deng L; Chen TC; Anderson GA; Prost SA; Norheim RV; Tolmachev AV; Smith RD, Characterization of Traveling Wave Ion Mobility Separations in Structures for Lossless Ion Manipulations. Anal Chem 2015, 87 (22), 11301–8. [DOI] [PMC free article] [PubMed] [Google Scholar]
- 21.Giles K; Williams JP; Campuzano I, Enhancements in travelling wave ion mobility resolution. Rapid Commun Mass Spectrom 2011, 25 (11), 1559–66. [DOI] [PubMed] [Google Scholar]
- 22.Appelhans AD; Dahl DA, SIMION ion optics simulations at atmospheric pressure. International Journal of Mass Spectrometry 2005, 244 (1), 1–14. [Google Scholar]
- 23.Hamid AM; Prabhakaran A; Garimella SVB; Ibrahim YM; Smith RD, Characterization of applied fields for ion mobility separations in traveling wave based structures for lossless ion manipulations (SLIM). International Journal of Mass Spectrometry 2018, 430, 8–13. [DOI] [PMC free article] [PubMed] [Google Scholar]
- 24.Merenbloom SI; Bohrer BC; Koeniger SL; Clemmer DE, Assessing the Peak Capacity of IMS−IMS Separations of Tryptic Peptide Ions in He at 300 K. Analytical Chemistry 2007, 79 (2), 515–522. [DOI] [PMC free article] [PubMed] [Google Scholar]
- 25.Ruotolo BT; McLean JA; Gillig KJ; Russell DH, Peak capacity of ion mobility mass spectrometry: the utility of varying drift gas polarizability for the separation of tryptic peptides. Journal of Mass Spectrometry 2004, 39 (4), 361–367. [DOI] [PubMed] [Google Scholar]
- 26.Hamid AM; Garimella SVB; Ibrahim YM; Deng L; Zheng X; Webb IK; Anderson GA; Prost SA; Norheim RV; Tolmachev AV; Baker ES; Smith RD, Achieving High Resolution Ion Mobility Separations Using Traveling Waves in Compact Multiturn Structures for Lossless Ion Manipulations. Anal Chem 2016, 88 (18), 8949–8956. [DOI] [PMC free article] [PubMed] [Google Scholar]
- 27.Shen Y; Lee ML, General Equation for Peak Capacity in Column Chromatography. Analytical Chemistry 1998, 70 (18), 3853–3856. [Google Scholar]
Associated Data
This section collects any data citations, data availability statements, or supplementary materials included in this article.


