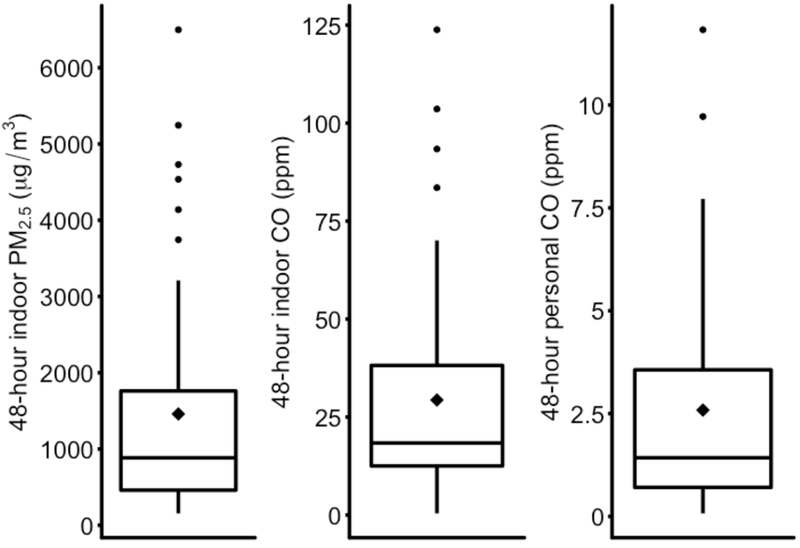
Figure 1.
Distributions of 48-hour indoor PM2.5 (µg/m3) and indoor and personal CO (ppm) concentrations among female cooks in rural Nicaragua. The lower boundary of the box represents the 25th percentile; the upper boundary represents the 75th percentile; the “◊”symbol inside the box is the mean; the line within the box is the median. The upper whisker is the third quartile plus 1.5 times the interquartile range (IQR), and the lower whisker is the first quartile minus 1.5 times the IQR. The dots are outliers.
Abbreviations: CO: Carbon monoxide; PM2.5: Particulate matter with diameter <2.5 micrometers; ppm: parts per million; µg/m3: micrograms per cubic meter.

