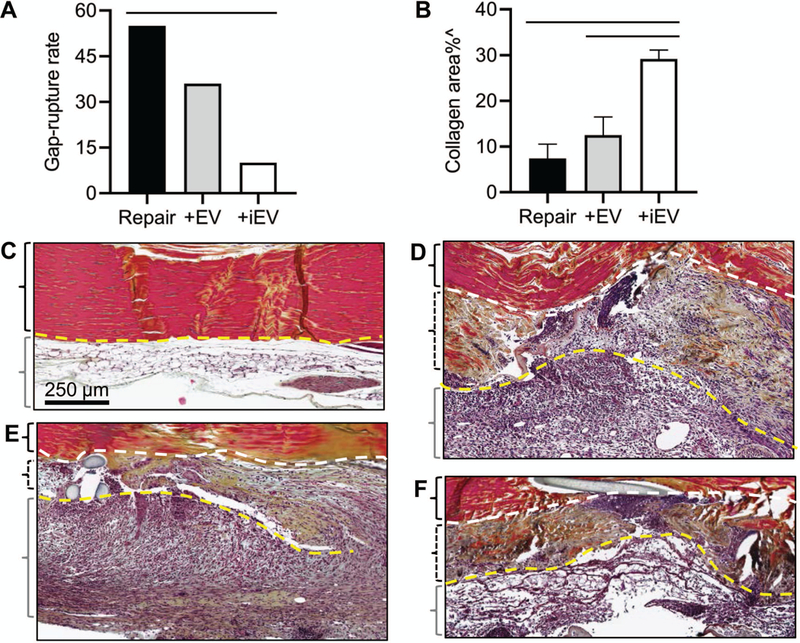
Figure 6.

Effects of ASC EVs on the tendon healing response 7 days after tendon injury and repair. (A) A comparison of gap and rupture rates of injured Achilles tendons from Repair, +EV and +iEV groups. —, P<0.05 between the indicated groups by an N-1 chi-squared test. (B) A comparison of the percentage of collagen-stained areas within the injured Achilles tendons from the indicated groups. ^, P<0.05 by one-way ANOVA. —, P<0.05 between the indicated groups by Tukey’s test. (C-F) Representative images of pentachrome-stained coronal sections of Achilles tendons from an intact (C) and partial transected Achilles tendons from repair only (repair, D), EV-treated (+EV, E), and iEV-treated (+iEV, F) groups. Scale bar in C applied to C-F. The yellow dotted lines delineate the boundaries between Achilles tendons and the surrounding paratenon tissues. The white dotted lines delineate the boundaries between the intact and the transected portions of repaired Achilles tendons. The black braces enclose the intact (C) or the intact portions (D-F) of Achilles tendons; the dotted black braces enclose the transected portions of repaired Achilles tendons; and the grey braces enclose the paratenon region of Achilles tendons.
