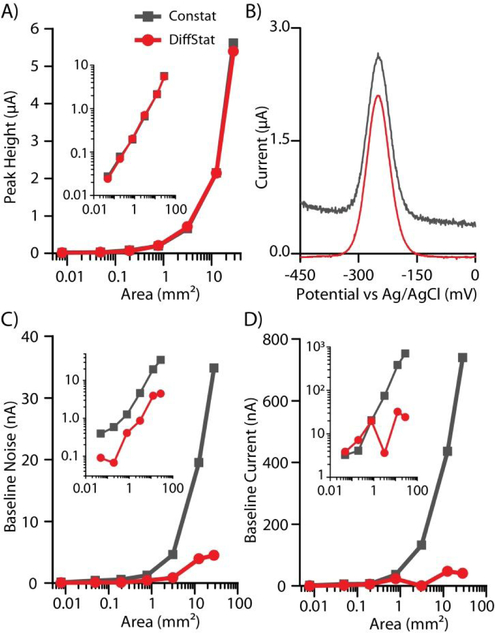
Figure 3.
Non-faradaic (capacitance) suppression across a wide range of electrode areas using square-wave voltammetry (SWV). A) Faradaic peak heights from 10 nM MB-DNA were equal using the DiffStat and ConStat, as shown in B) example unprocessed SWV data with a 4 mm diameter electrode. However, C) baseline noise and D) non-faradaic baseline current (forward SWV) was greatly reduced using the DiffStat (red) compared to the ConStat (gray). Insets show log-log plots of the same data.

