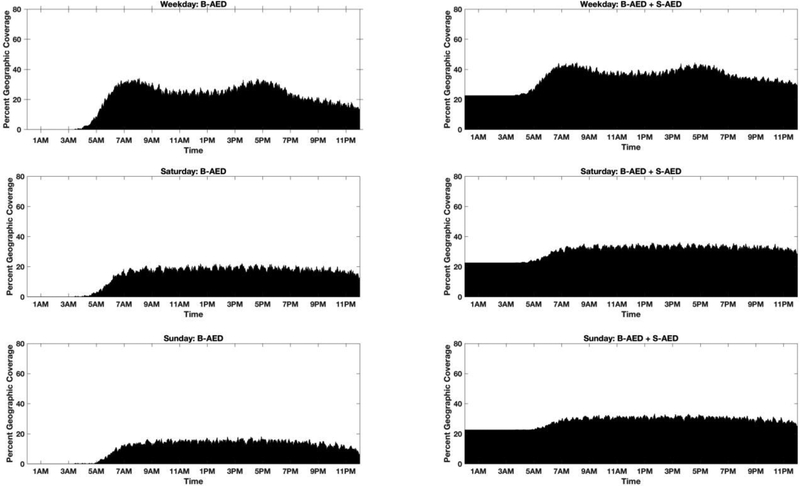
Figure 2. Temporal Trends in Geographic Coverage Across Time from Simulation #1.
Temporal trends in cumulative geographic AED coverage are shown for B-AEDs alone (left column) and B-AEDs combined with S-AEDs (right column) assuming a 1/8th mile accessibility radius. In the right column, the flat area of the plot during the early morning hours reflects availability of only S-AEDs when buses are not running. Abbreviations: B-AED – Bus AED, S-AED – Static AED.

