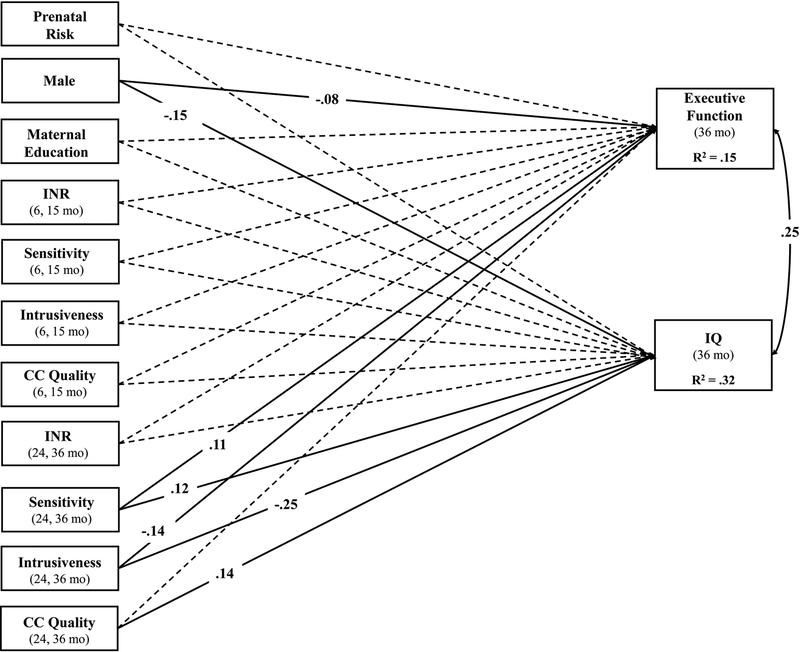
Figure 1.
Path model illustrating total effects of prenatal and postnatal factors on EF and IQ at age 3 years. Single-headed arrows represent regression paths, while curved, double-headed arrows represent correlations. Standardized parameter estimates are presented for all significant paths (p < .05) using solid lines, whereas non-significant paths are presented using dotted lines. All exogenous variables were allowed to covary. INR = income-to-needs ratio; CC = childcare.

