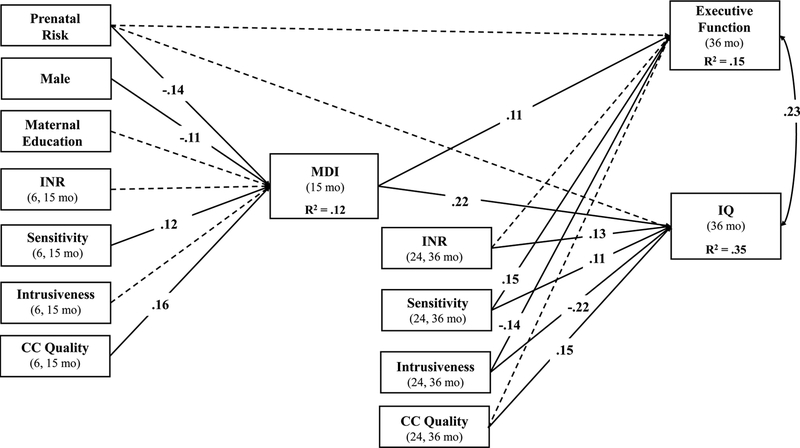
Figure 2.
Path model illustrating a cascade of effects from prenatal risk to EF and IQ at age 3 years via general cognitive ability (Bayley Mental Developmental Index [MDI]) at 15 months. Single-headed arrows represent regression paths, while curved, double-headed arrows represent correlations. Standardized parameter estimates are presented for all significant paths (p – .05) using solid lines. Non-significant paths are presented using dotted lines. For simplicity, paths from covariates (male, maternal education) to EF and IQ are not pictured. Additionally, all exogenous variables were allowed to covary. INR = income-to-needs ratio; CC = childcare.

