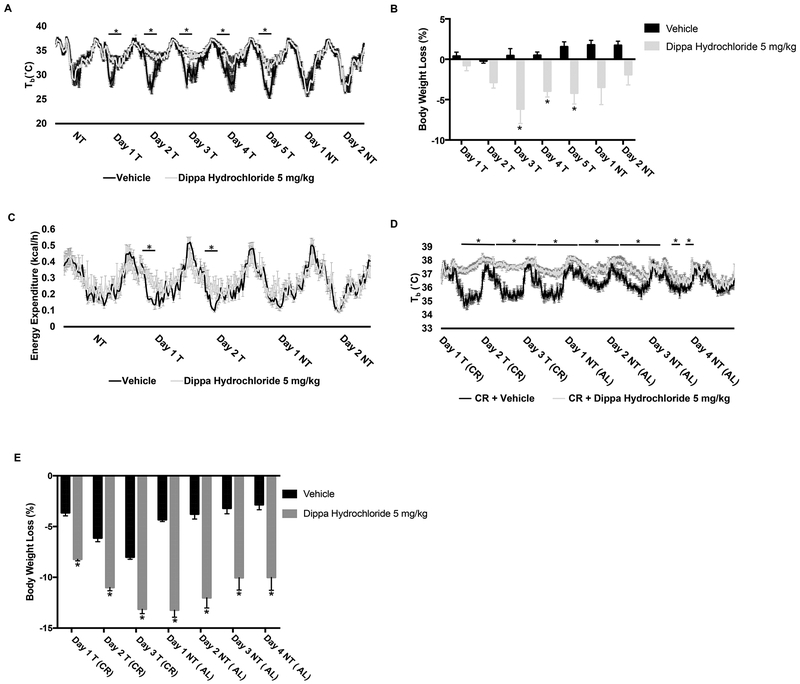
Figure 4. KOR antagonism promotes body weight loss during calorie restriction and obesity.
(A) Tb profile, (B) percentage of body weight loss and (C) energy expenditure of lean mice on 50% CR, before, during and after administration of DH or Vehicle. (D) Tb profile (E) percentage of body weight loss. (A-E) n= 6 mice per treatment; graphs show mean ± SEM. Tb. energy expenditure and body weight differences between treatments were analyzed by two-way ANOVA followed by Sidak’s multiple comparisons test (A) F (4, 50) = 100.8, P <0.0001; Sidak’s: P <0.0005 each day on treatment. (B) F(1, 10) = 13.77, P = 0.0040; Sidak’s: P < 0.03 each day on treatment. (C) F (1, 20) = 15.35 P = 0.0009; Sidak’s: *P <0.05 each day on treatment. (D) F (1, 63) = 270.4, P <0.0001; Sidak’s: *P <0.05 for specific time-points between groups. (E) F(1, 10) = 97.31, P < 0.0001; Sidak’s: P < 0.0001 each day. Abbreviations: T: treatment, NT: no treatment, CR: calorie restriction and AL: ad libitum. The effects of Dippa Hydrochloride on food intake are shown in Figure S3.

