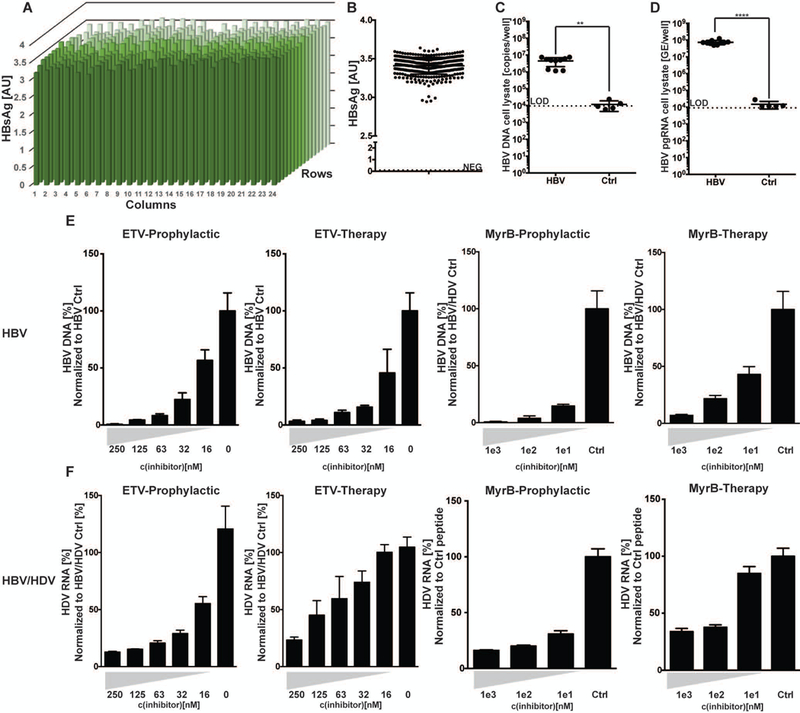
Fig. 3. Assessment of clinically relevant drug treatments for HBV mono-infection and HBV/HDV co-infection of SACC-PHHs in a 384 well microwell format.

(A) SACC-PHHs in a 384 well format were infected with HBV and viremia assessed for each well by HBsAg ELISA. (B) Summary of HBsAg concentrations determined across plate shown in (A). Coefficient of variance across the 384 well plate equaled 3.2%. HBV DNA (C) and HBV pgRNA (D) from cell lysates of HBV infected vs control cultures as assessed by qPCR (HBV n=10; control n=5). For panel (E), SACC-PHHs were challenged with HBV. The x-axis equals drug concentration and the y-axis the amount of HBV DNA (for ETV) or HBsAg secretion (for MyrB) normalized to untreated, HBVcc-infected untreated control cells or HBVcc-infected cells treated with a control peptide, respectively. For panels (F) SACC-PHHs were co-infected with HBV/HDV and HDV RNA was quantified by RT-qPCR in supernatant (far left) and cell lysate (second from left). Co-infected SACC-PHHs were treated with the entry inhibitor MyrB prophylactically (second from right) or therapeutically (far right), with the x axis showing drug concentration and the y axis the amount of HDV RNA present in the supernatant normalized to that secreted by co-infected cells treated with a control peptide. All data are presented as mean ± SEM. Statistical significance was determined using ANOVA. *P < 0.05, **P < 0.01, ***P < 0.001, and ****P < 0.0001.
