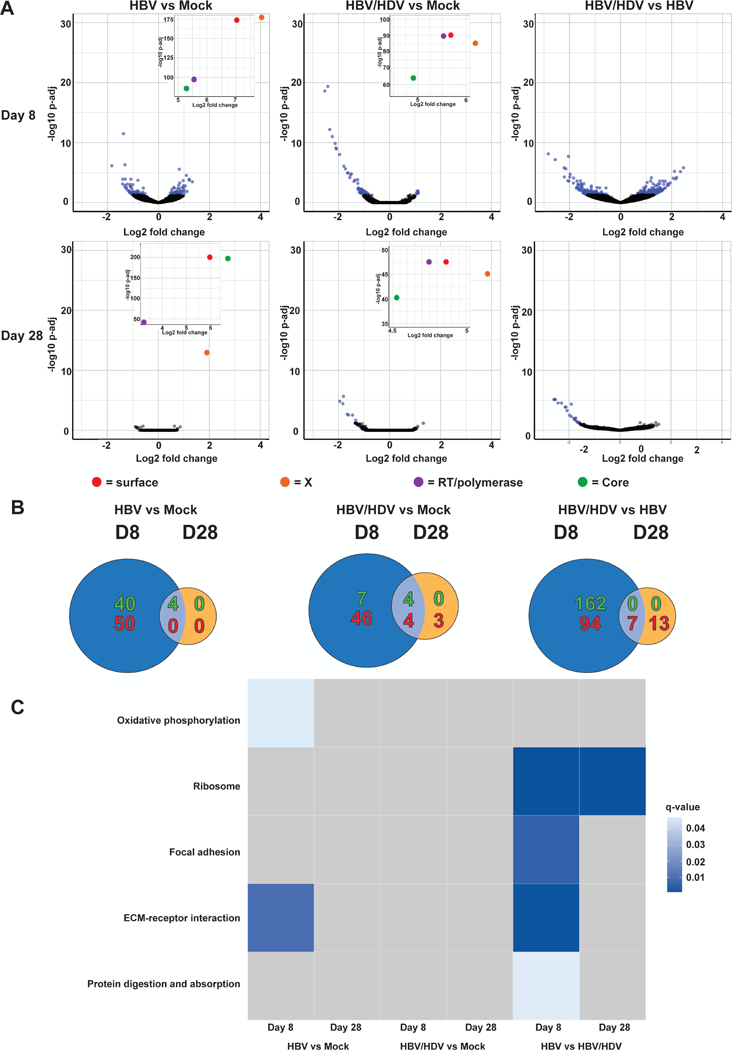
Fig. 5. Transcriptomic analysis of “early” and “late” stage of HBV mono-infected and HBV/HDV co-infected SACC-PHHs.

RNA was isolated at 8 and 28 dpi from SACC-PHHs HBV mono-, HBV/HDV co- or mock-infected. A cDNA library was then generated and sequenced. (A) Volcano plots of differentially expressed genes in mono-infected vs mock, co-infected vs mock, or co- vs mono-infected at 8 dpi (top row) and 28 dpi (bottom row). Each point represents a gene, with those having a padj ≤ 0.05 colored blue and those with a padj > 0.05 colored black. HBV genes are indicated in red, orange, purple or green. (B) Venn diagram of genes up- (shown in green) or down-regulated (shown in red) between mono-infected vs mock, co-infected vs mock, and co- vs mono-infected at 8 and 28 dpi. Genes were considered up- or down-regulated if the absolute value of log2(fold change) ≥ 0.5 and padj ≤ 0.05. (C) Significantly enriched pathways (q-value ≥ 0.07) determined using GAGE comparing mono-infected vs control, co-infected vs control, and co- vs mono-infected at 8 and 28 dpi.
