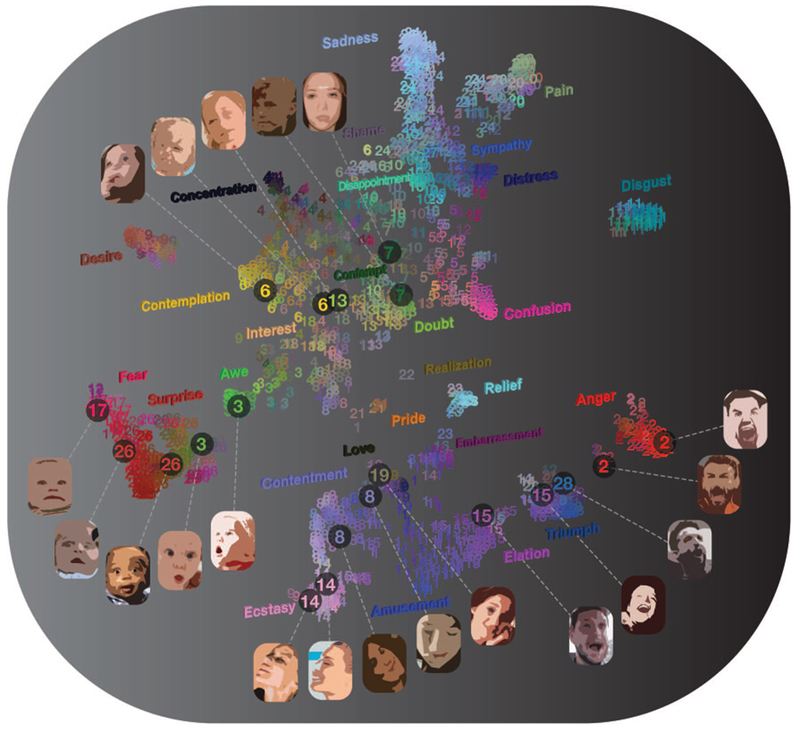
Figure 2.

Mapping of expression judgment distributions with t-distributed stochastic neighbor embedding (t-SNE). t-SNE projects the data into a two-dimensional space that approximates the local distances between expressions. Each number corresponds to a single naturalistic expression and reflects the most frequent category judgment. The t-SNE map reveals smooth structure in the recognition of emotion, with variations in the proximity of individual expressions within each category to other categories. These variations are exemplified by the example expressions shown. Face images have been rendered unidentifiable here via artistic transformation. The expressions and their assigned judgments can be fully explored in the interactive online version of this figure: https://s3-us-west-1.amazonaws.com/face28/map.html. See the online article for the color version of this figure.
