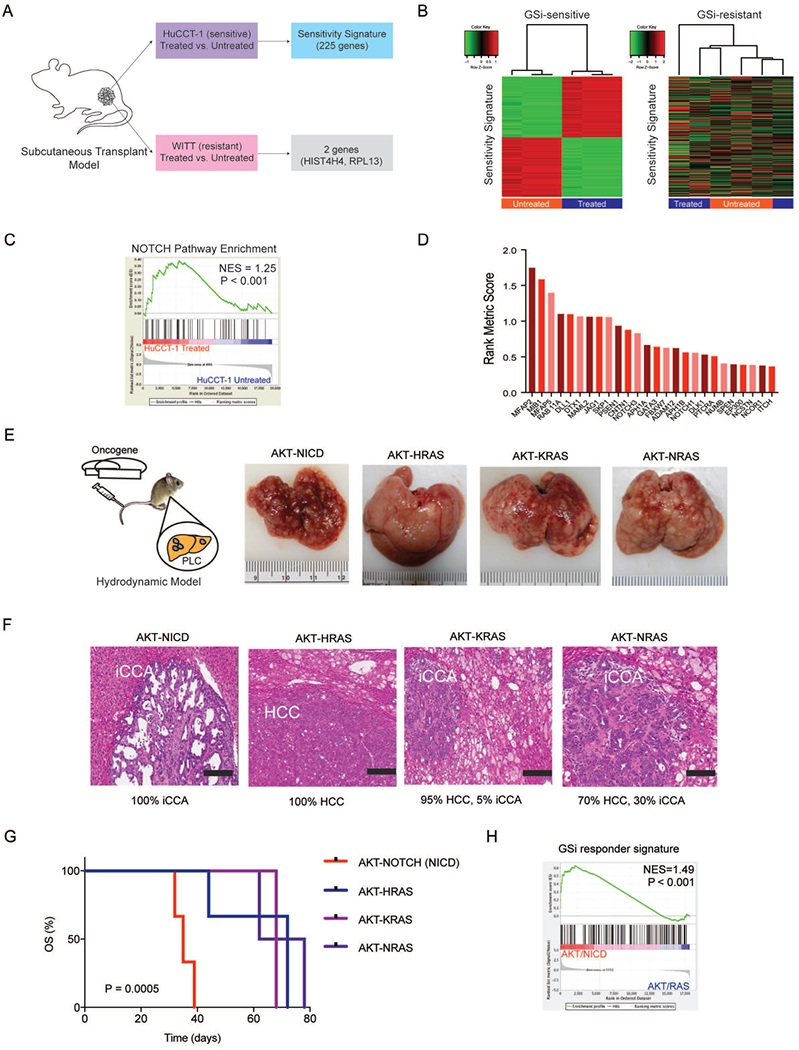
Figure 4. Development and validation of a GSi-responder signature in vivo.

(A) Schematic overview of generating the GSi-sensitivity signature using xenograft models of GSi sensitive (HuCCT-1) and resistant (WITT) cell lines treated with GSi. (B) Hierarchical clustering using 225-gene responder signature in sensitive and resistant tumors. (C) Gene set enrichment analysis (GSEA) of NOTCH pathway in sensitive tumors with and without GSi treatment. NES: normalized enrichment score. (D) Rank metric scores of NOTCH pathway mRNA transcripts significantly altered in xenograft tumors initiated by GSi treatment. (E) Schematic overview of the hydrodynamic tail vein models (AKT/NICD, AKT/HRASG12R, AKT/KRASG12D, AKT/NRASG12V) used to generate primary liver tumors in vivo and gross liver morphology at the end of study. (F) Histopathological classification of primary liver tumors formed across each of the hydrodynamic mouse models. H&E staining (scale bar, 200 μm). (G) Survival analysis for each of the hydrodynamic mouse model groups. Kaplan-Meier and Mantel-Cox statistics were used to determine levels of significance. (H) GSEA of GSi-responder signature in NOTCH-driven tumors versus RAS-driven tumors. NES: normalized enrichment score.
