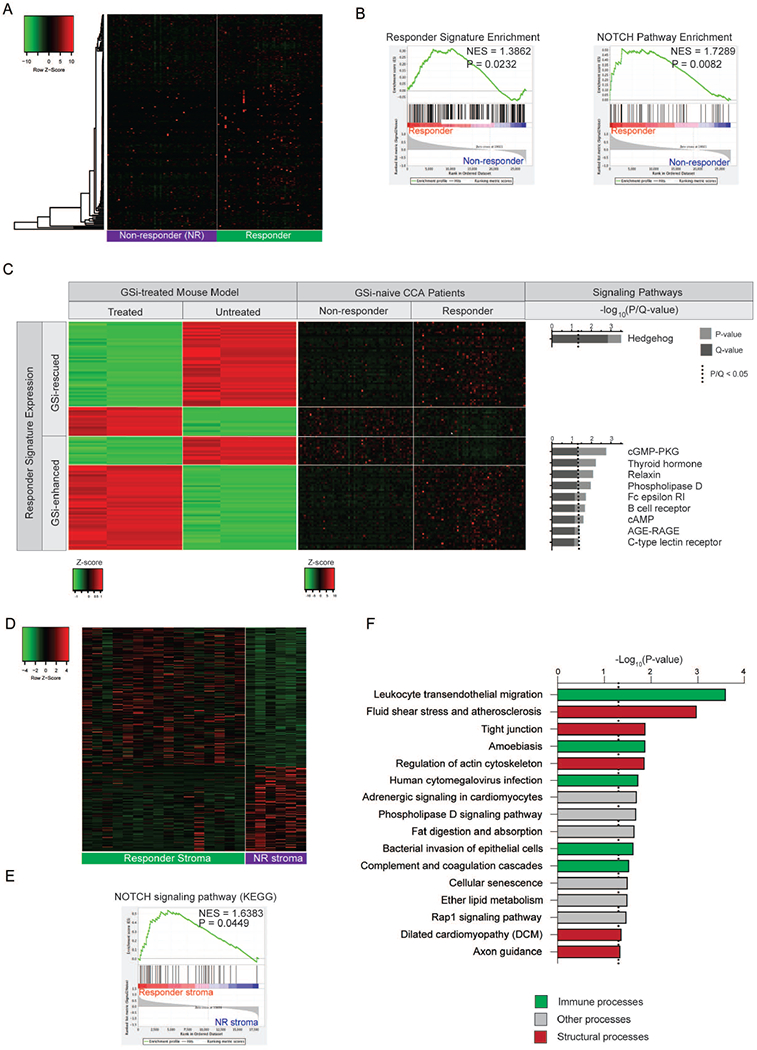
Figure 5. Identification of GSi-responder CCA patients ex vivo.

(A) Heatmap of mouse-derived GSi-responder signature expression in predicted responder and non-responder patient subgroups. NMF-based clustering using the responder signature was utilized to stratify patients. (B) Gene set enrichment analysis (GSEA) of mouse-derived GSi-responder signature and NOTCH pathway in predicted responder versus non-responder patients. NES, normalized enrichment score. (C) Heatmaps illustrating expression of 124-gene responder signature (classified as GSi-enhanced or GSi-rescued) genes mutually differentially expressed in patients (responders versus non-responders) and rescued subcutaneous mouse models (treated versus untreated) with corresponding over-represented signaling pathways. (D) Heatmap of 331-gene GSi-responder stromal signature in 22 microdissected CCA stroma samples. (E) Gene set enrichment analysis (GSEA) of NOTCH signaling pathway (KEGG) in GSi-responder versus non-responder stroma. NES: normalized enrichment score. (F) KEGG pathway over-representation analysis of the 331-gene GSi-responder stromal signature.
