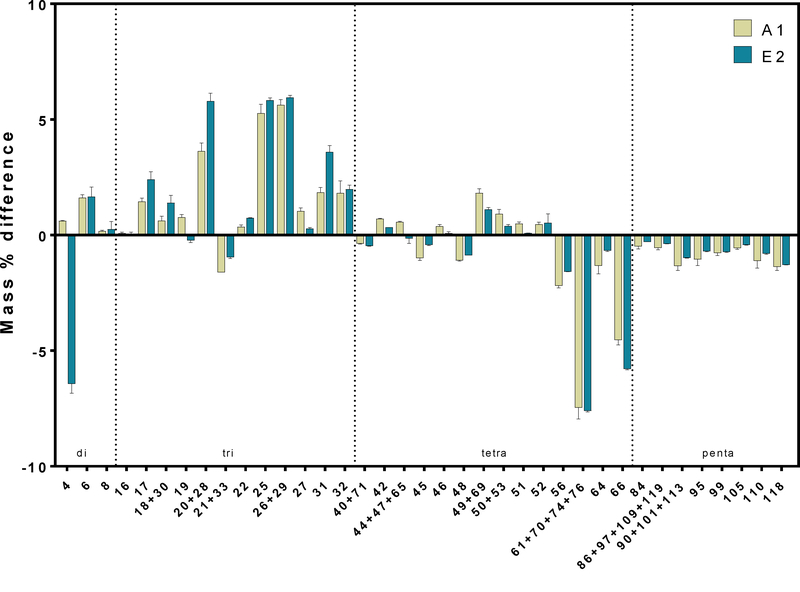
Figure 2.
Difference between the PCB profile at 430 days and 0 days in microcosms inoculated with A1 and E2 sediments. Only congeners that represent 1% of the total mass fraction at either 0 or 430 days are shown. Error bars show the standard deviation between replicates. Positive values indicate accumulations in the specified congener over the 430 day incubation, and negative values indicate the congener decreased over time.

