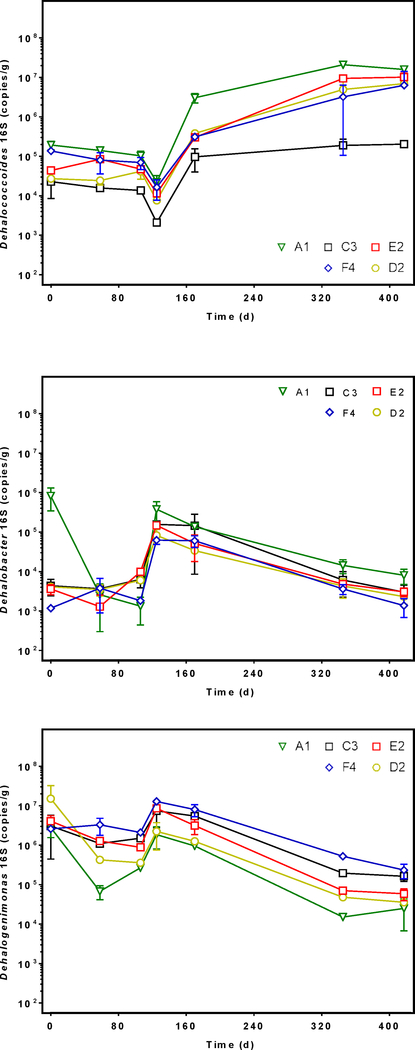
Figure 3.
Dehalococcoides (top), Dehalobacter (middle), and Dehalogenimonas (bottom) 16S rRNA gene sequence abundance in DNA extracted from spatially variable sediment microcosms (A1, C3, D2, E2, F4) as measured by qPCR. Error bars show the standard deviation between replicates. Each marker represents the average 16S sequence abundance at different lengths of incubation time from 0 to 417 days.

