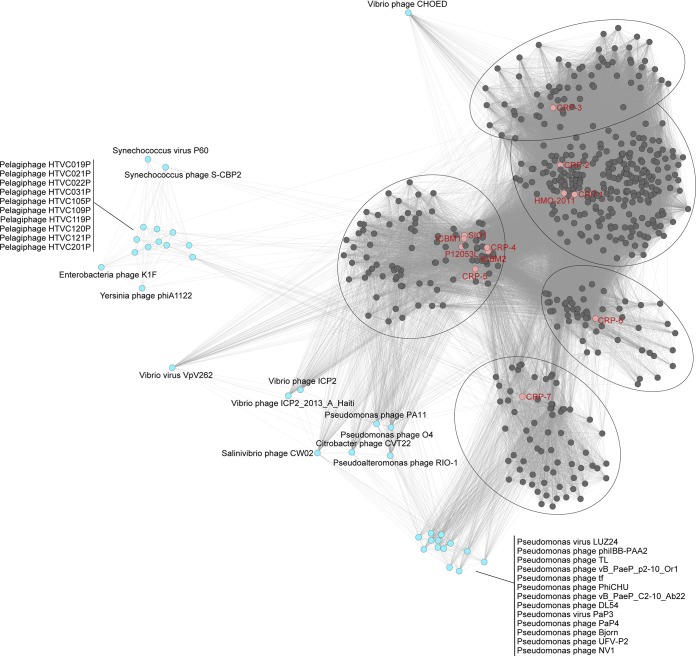
FIG 3.
Gene-content-based viral network of RCA phages and related bacteriophages and environmental viral contigs. Nodes represent phages, and the weight of each edge represents the distance between two phages based on the similarity score, with a cutoff of ≥1. For clarity, viral genomic contigs that were not grouped with the RCA phages were excluded and bacteriophage genomes that do not link to the four viral clusters were excluded. Different viral clusters defined by vConTACT 2.0 are circled. Viral clusters generated by vConTACT2 are provided in Table S2 in the supplemental material.

