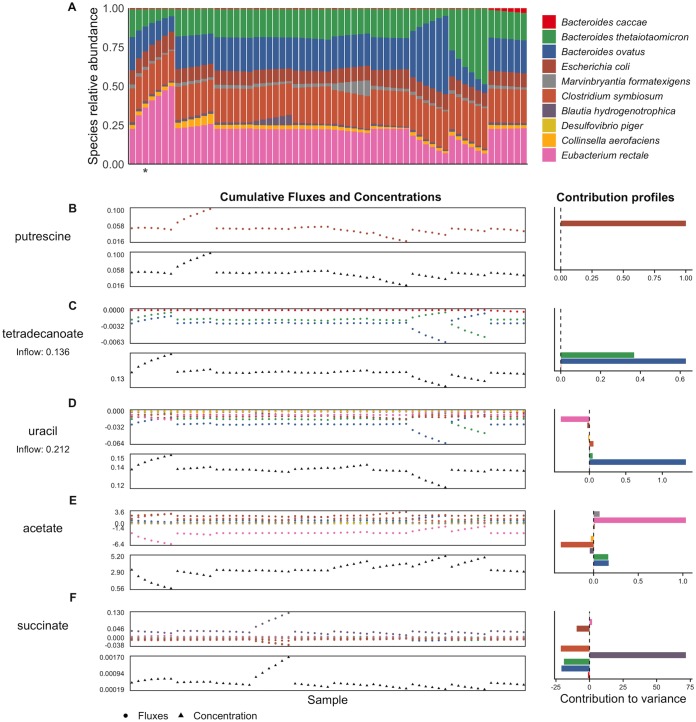
FIG 2.
Species abundances, cumulative fluxes, and contributions to variance in metabolite concentrations in the 10-species simulated data set. (A) The data set of species abundances at the final time point of 61 simulation runs. Each bar represents a simulation run, with the colors indicating relative abundance of each species. The abundance profile from the simulation runs highlighted in Fig. 1 is indicated with an asterisk. (B to F) For five example metabolites, namely, putrescine (B), tetradecanoate (C), uracil (D), acetate (E), and succinate (F), the upper plot shows the total cumulative secretion or uptake of that metabolite by each species across all 61 simulation runs (or samples), and the lower plot shows the corresponding environmental concentration at the final time point. The bar plots on the right show the contribution values for each species and metabolite calculated from the flux values and describing the linear contribution of each species to the overall metabolite variance.

