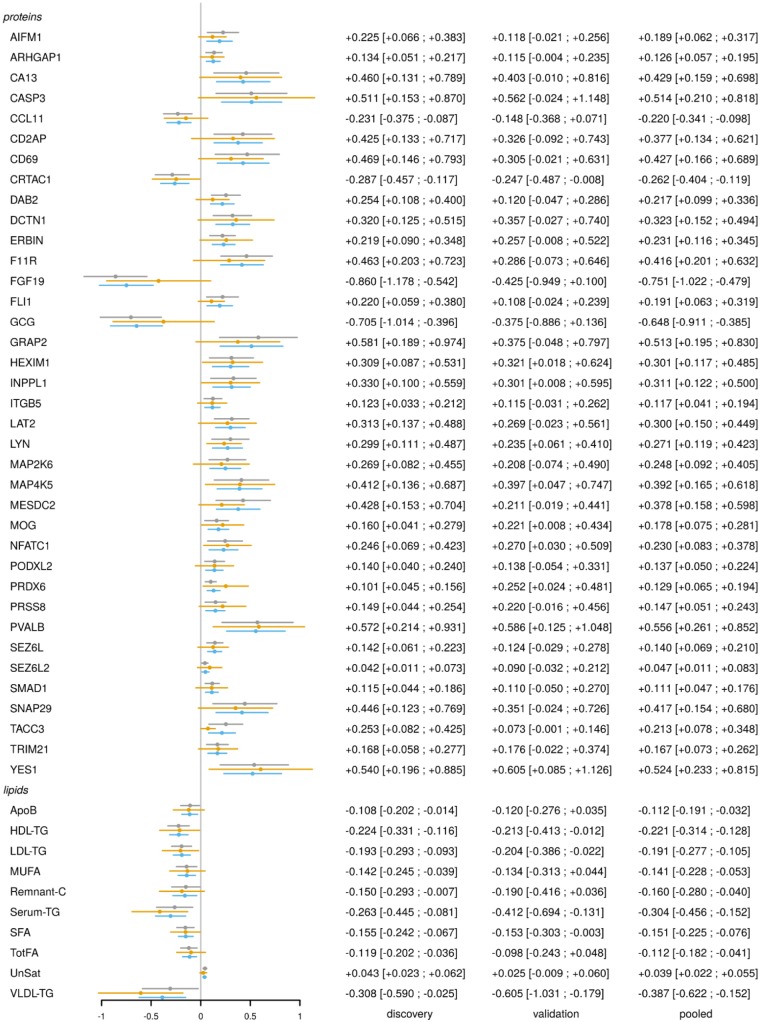
Figure 3.
FMD protein and lipid signature. Forest plot of association between validated FMD proteins and lipids, and FMD status, in three datasets: discovery cohort (grey lines), validation cohort (gold lines), and pooled cohort (blue lines). Estimated log2-fold changes on the horizontal axis, protein, and lipid labels on the vertical axis. Point estimates and 95% confidence intervals are further reported on the right.

