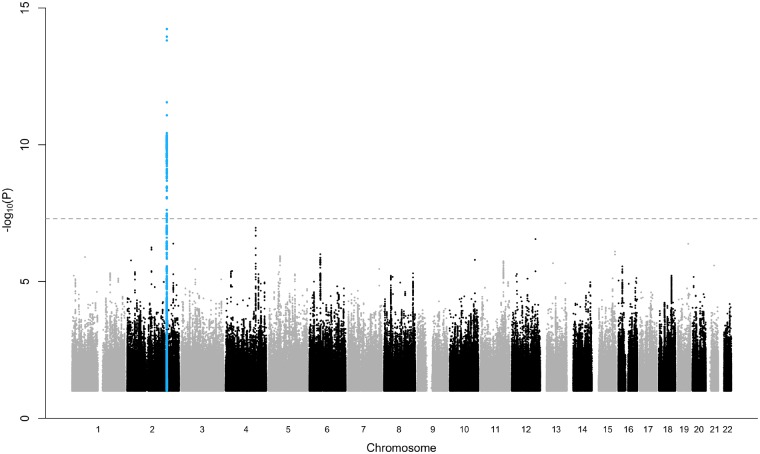
Figure 1.
Manhattan plot. Manhattan plot showing the association of single nucleotide polymorphisms (SNPs) with syncope and collapse in a genome-wide association study of 9163 cases and 399 798 controls. The grey dashed horizontal line marks the threshold for genome-wide significance (P = 5 × 10⁻⁸). Statistical significance of SNPs is shown on the y-axis as −log10(P) as a function of chromosomal position (x-axis). P-values are calibrated from score test with saddlepoint approximation.

