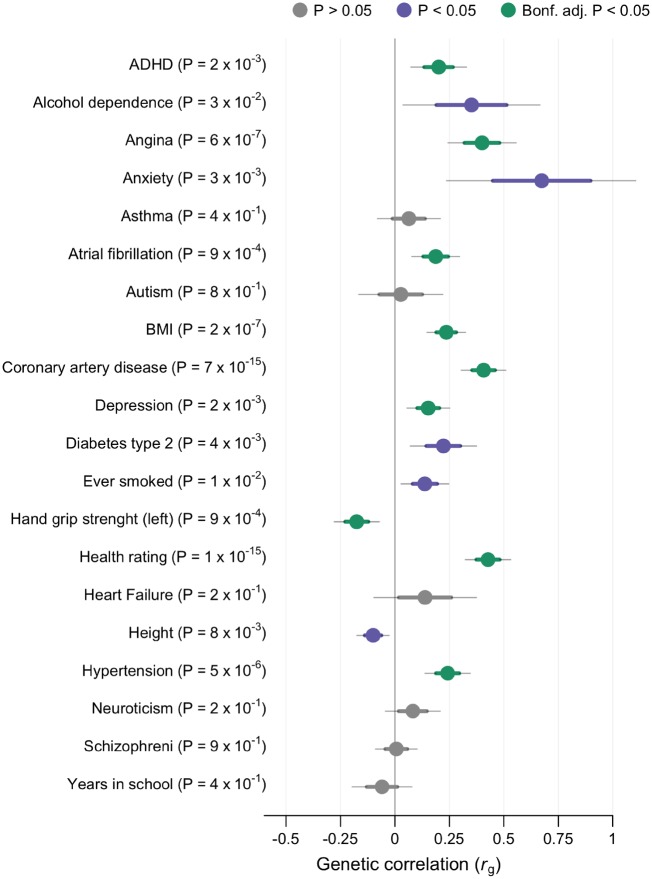
Figure 3.
Genetic correlation. LD score regression revealing genetic correlation with syncope and collapse (9163 cases and 399 798 controls) and other phenotypes. Sample sizes of external genome-wide association studies are shown in Supplementary material online, Data S1. Phenotypes with negative log10(P) are displayed on the y-axis. X-axis show genetic correlation (rg). Dots are estimated values with thick lines indicating mean standard error (SE) and thin lines 1.96 × SE. Significant association after Bonferroni corrections is denoted with green colour. Nominal significance is denoted with violet colour and non-significant correlations with grey. Standard errors and P-values were derived from using block jackknife resampling.

