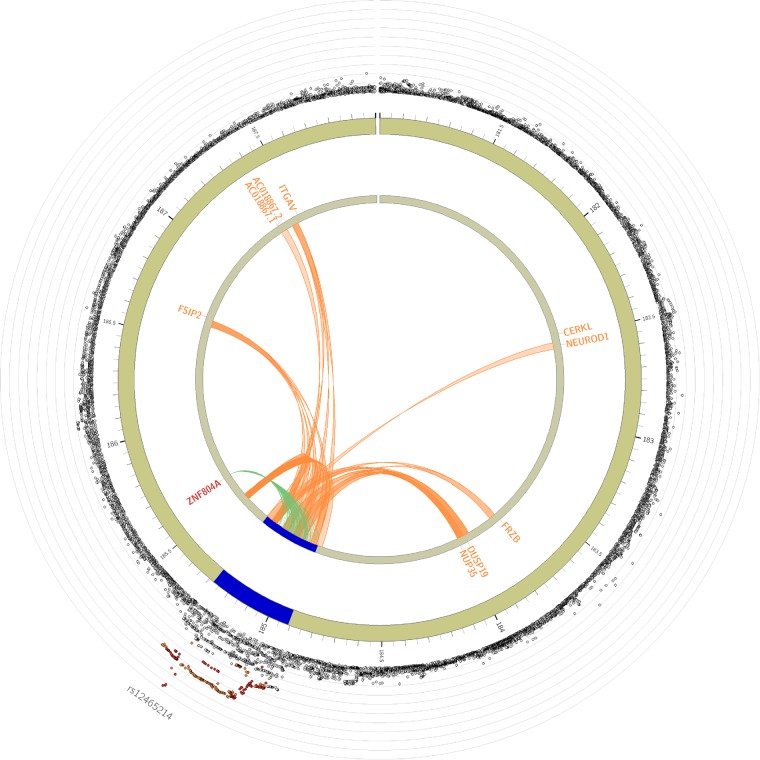
Figure 4.
Circo plot displaying eQTL and chromatin interaction for the risk locus. The most outer layer shows a regional plot, displaying rsID of lead SNPs. The height of the y-axis indicates significance in negative log10 scale. Only SNPs with P < 0.05 are displayed. SNPs in genomic risk loci are colour-coded as a function of their maximum r2 to one of the distinct significant SNPs in the locus, as follows: red (r2 > 0.8), orange (r2 > 0.6), green (r2 > 0.4), and blue (r2 > 0.2). SNPs that are not in LD with any of the independent significant SNPs (with r2 ≤ 0.2) are grey. The second layer shows chromosome with genomic risk loci highlighted in blue. Only mapped genes by either chromatin interaction and/or eQTLs are displayed. If the gene and links are mapped only by chromatin interactions or only by eQTLs, it is coloured orange or green, respectively. When the gene is mapped by both it is coloured red.

