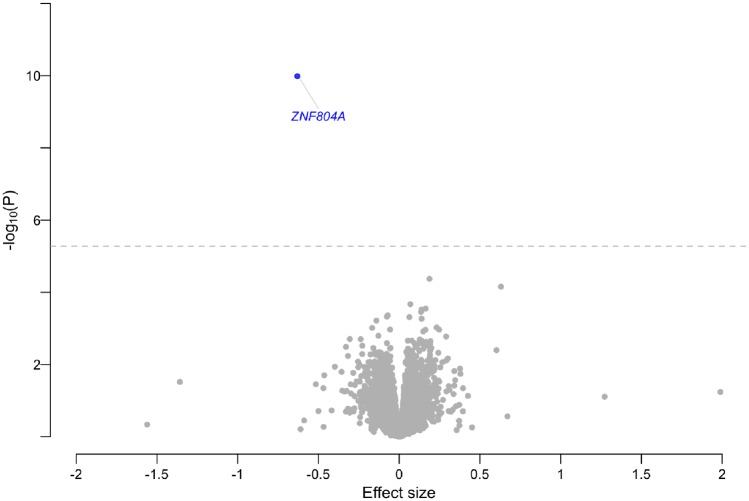
Figure 5.
Volcano plot of transcriptome analysis. Plot showing results from MetaXcan transcriptome analyses based on GTEx v.7 thyroid tissue (n = 323) and syncope and collapse summary statistics (9163 cases and 399 798 controls). The effect size associated with increased or decreased expression with syncope risk is shown on the x-axis. The y-axis show −log10(P) for each tested gene. The dashed line indicates the Bonferroni threshold (P = 0.05/9504). Genes with a negative effect and significant association are demarked as blue dots. Non-significant genes are demarked as grey dots. Significance was assessed (P-values) with Wald tests.

