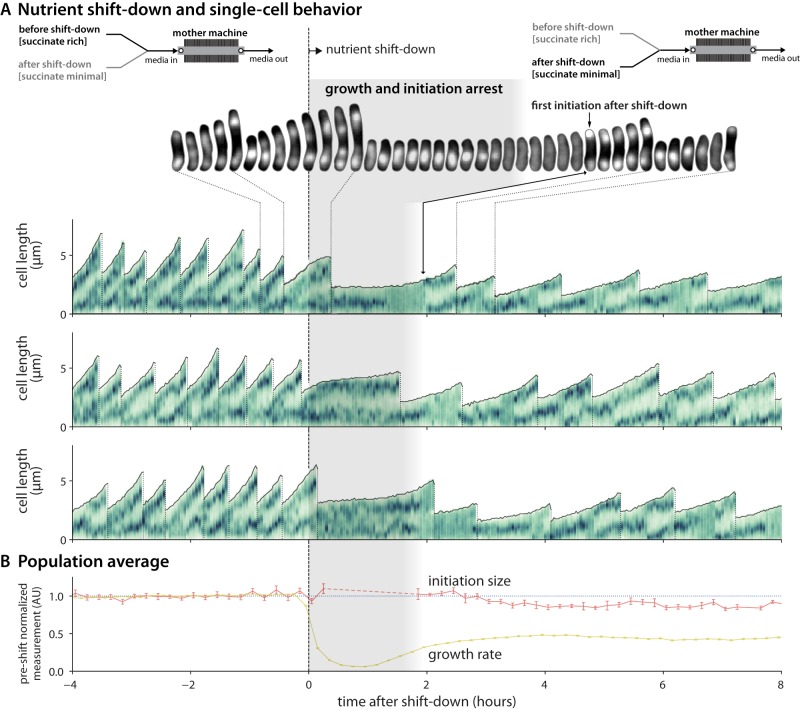
FIG 5.
Initiation size is invariant in B. subtilis during the shift down. (A) Behavior of single cells undergoing the shift down from succinate-rich to succinate-minimal conditions at time zero. Upon the shift down, cells pause growth and initiation for 1 to 2 h. The medium shift is achieved via a Y valve upstream of the mother machine inlet. (Top) Fluorescent images of cell lineage during the shift down. (Bottom) Representative traces of 3 lineages. Representation is as described for Fig. 3, with the density of the vertical green bars representing the intensity of the DnaN-mGFPmut2 signal along the long axis of the cell. (B) Population average behavior during the shift down. Growth rate data represent the instantaneous elongation rate (6-min time step). Initiation size per ori is plotted against the initiation time. Each measurement is normalized to the corresponding mean in the 4 h before the shift down. Lines connect the 12-min binned mean, and error bars represent standard errors of the means. The minimum bin size is 5. The dashed-line portion of the line representing average initiation size signifies a gap in initiation events after the shift down. n = 3,160 cells (752 with initiation size). The entire time course showing the shift up and the shift down is available in Fig. S6.

