FIG 6.
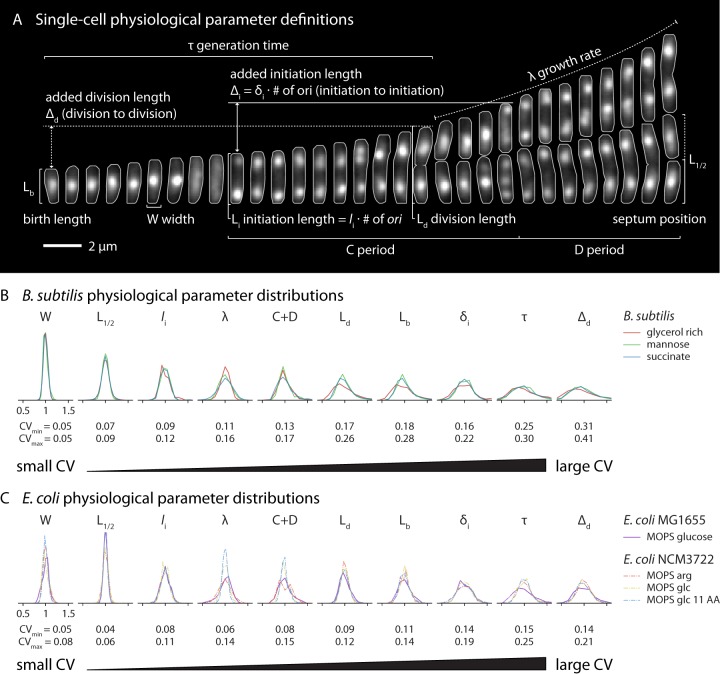
B. subtilis and E. coli share the same hierarchy of physiological parameters. (A) Single-cell physiological parameter definitions as determined from time-lapse images. The cells were B. subtilis growing in mannose (τ = 38 min). The fluorescent signal represents DnaN-mGFPmut2, and the gray outlines are from the segmented phase-contrast image. The picture interval was 3 min. (B) B. subtilis parameter distributions are shown in order of ascending coefficient of variation (CV) values. Parameters are normalized to their means. The range of CVs for each parameter is shown below the distributions. Note that length-based parameters are shown here; their volume equivalents have slightly higher CVs due to variability in width. (C) Distribution of the same measurements in E. coli displaying the same CV hierarchy. Data representing E. coli NCM3722 grown in MOPS arginine (arg), glucose (glc), and glucose plus 11 amino acids (glc 11 AA) are from previously published work (7).

