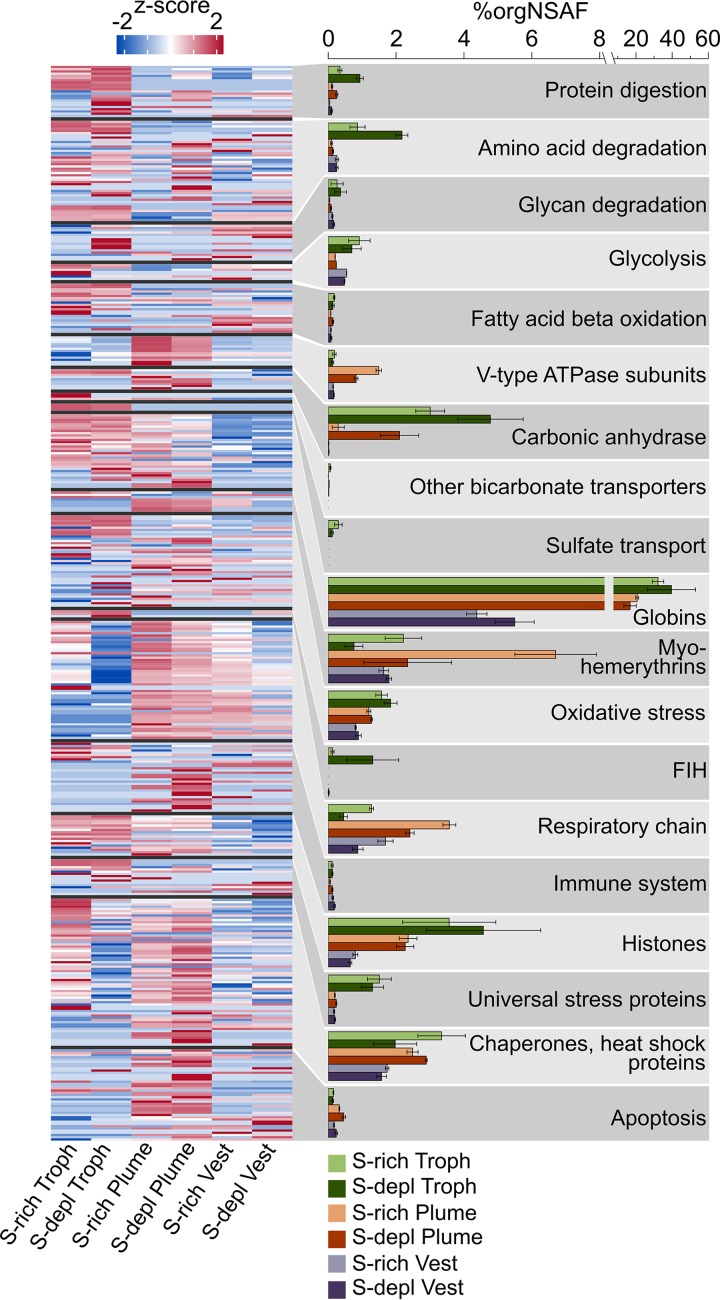
FIG 2.
Functional groups of selected Riftia host proteins and their relative abundances in tissue samples. The heatmap shows log-normalized, centered, and scaled protein abundances. The bar chart shows summed abundances in %orgNSAF (percent normalized spectral abundance factor per organism, i.e., of all host proteins) of all proteins in the respective category. Error bars indicate standard error of the mean. Note the different scaling in the right part of the x axis. The “Chaperones, heat shock proteins” category also includes chaperonins and Clp proteases. FIH, factor inhibiting hypoxia-inducible factor 1α. S-depl, S depleted. Vest, vestimentum. Troph, trophosome. For a list of all identified proteins and their abundances, see Table S1a. (Categories presented in this figure are labeled with X in Table S1a in the column labeled Figure 2. The table can be filtered for these categories.)

