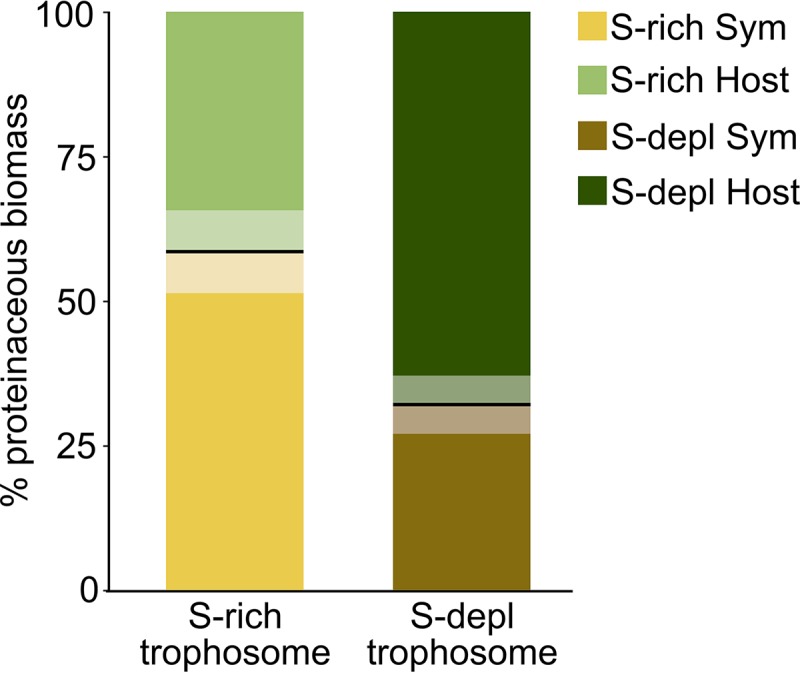
FIG 6.

Percent proteinaceous biomass contributions of host and symbiont as calculated from the share of host and symbiont spectral counts in all spectral counts of the respective samples (127; see Materials and Methods for details). Boldface lines indicate the means, and semitransparent areas indicate standard error of the mean. Sym, symbiont; S-depl, S depleted.
