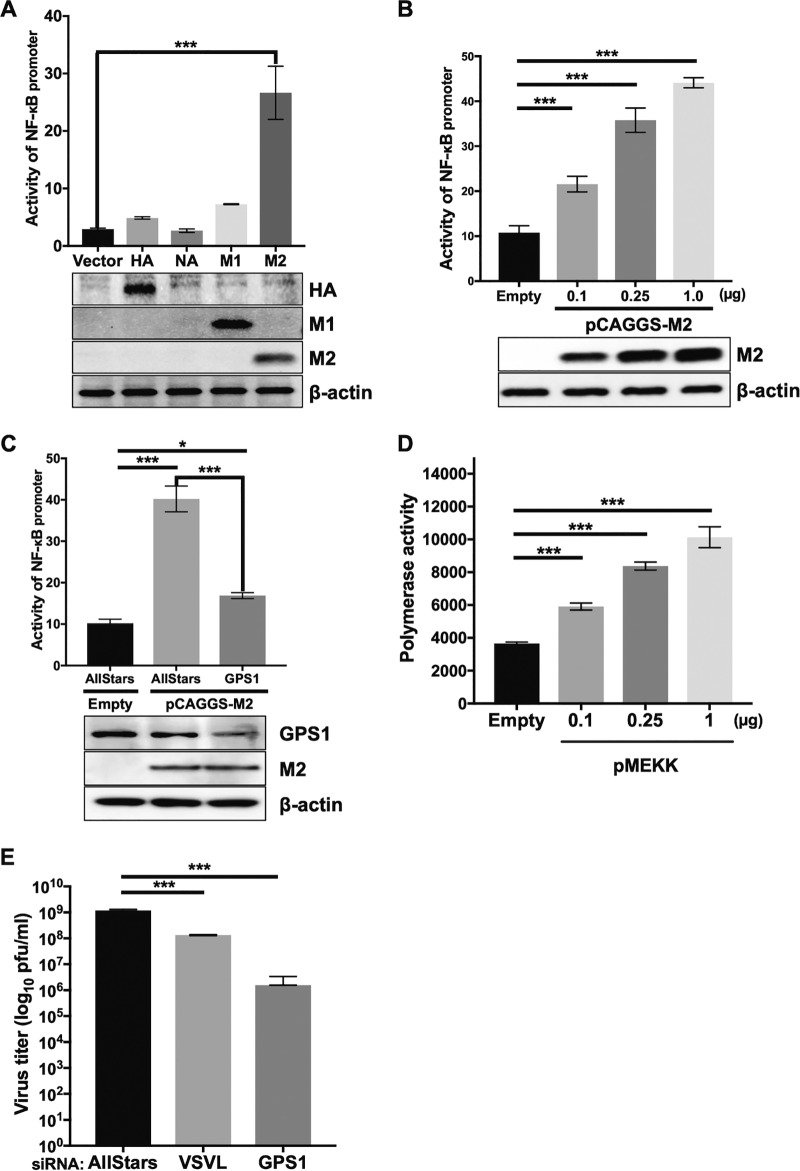
FIG 7.
Correlation between GPS1, NF-κB signaling, M2, and influenza virus polymerase activity. (A and B) Activation of NF-κB signaling via the expression of influenza virus proteins. The effect of influenza virus protein expression on NF-κB signaling pathway activation was assessed by expressing the influenza virus M2, M1, HA, or NA protein in cells. Influenza virus M2-, M1-, HA-, or NA-expressing plasmids and an NF-κB reporter plasmid encoding luciferase were transfected into HEK293 cells 24 h after siRNA treatment. Luciferase activities were measured 24 h after the plasmid transfection. The expression of HA, M1, and M2 was examined by Western blotting. The tests were performed in triplicate, and the error bars represent the standard deviation for triplicate samples. Statistical analysis was carried out by using ANOVA, followed by Dunnett’s test. ***, P < 0.001 for three independent experiments. (C) Effect of GPS1 on the NF-κB signaling pathway when the pathway is activated by M2. HEK293 cells were treated with AllStars siRNA or siRNA for GPS1. Twenty-four hours later, an NF-κB reporter plasmid encoding luciferase and an M2 protein-expressing plasmid were transfected into the cells. Luciferase activities were measured 24 h after the plasmid transfection. The downregulation of GPS1 and the expression of M2 were examined by Western blotting. The tests were performed in triplicate, and the error bars represent the standard deviation for triplicate samples. Statistical analysis was carried out by using ANOVA, followed by Dunnett’s test. *, P = 0.013 for three independent experiments; ***, P < 0.001 for three independent experiments. (D) Virus polymerase activities under the active NF-κB signaling pathway. Polymerase activities were assessed by using a minireplicon assay. An MEKK-expressing plasmid was transfected together with viral polymerase protein-expressing plasmids. Luciferase activities were measured 24 h after the plasmid transfection. The tests were performed in triplicate, and the error bars represent the standard deviation for triplicate samples. The statistical analysis was carried out by using ANOVA, followed by Dunnett’s test. ***, P < 0.001 for three independent experiments. (E) Effect of GPS1 downregulation in VSV. The titer of VSV in GPS1-downregulated cells was assessed by means of a plaque assay. VSVL, the polymerase L protein of VSV, which is responsible for virus genome transcription and replication. The tests were performed in triplicate, and the error bars represent the standard deviation for triplicate samples. The statistical analysis was carried out by using ANOVA, followed by Dunnett’s test. ***, P < 0.001 for three independent experiments.

