
Figure 6.
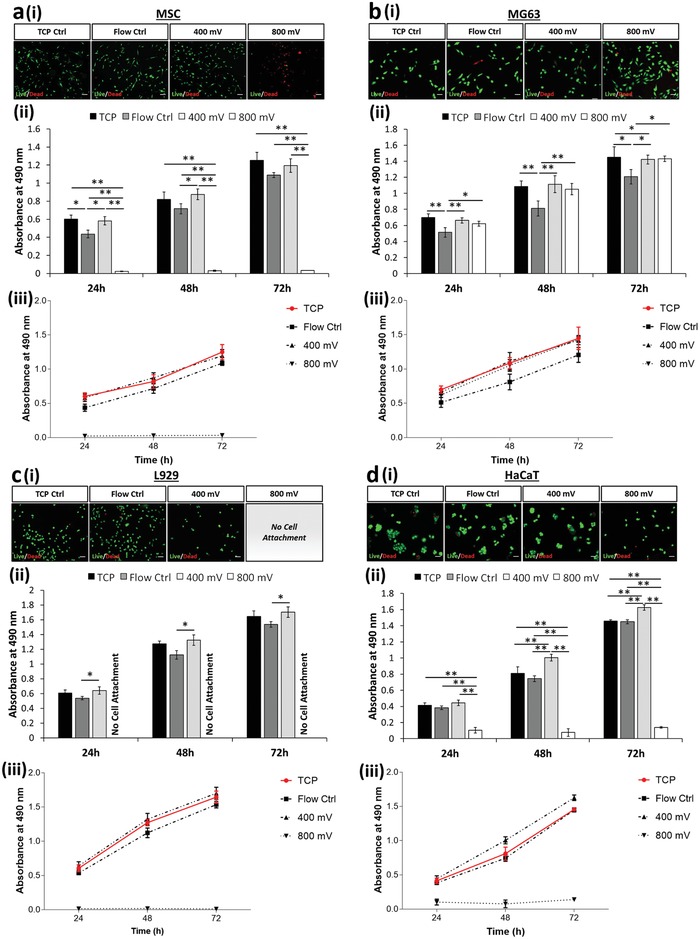
Increasing channel dimensions (i.e., 50 µm channel height) presents enhanced acoustic effects while enabling a) MSC and b) MG63 cell extraction. Decreasing the flow rate (i.e., 5 µL min−1) modulates metabolic activity of c) L929 and d) HaCaT while retaining a high degree of cell viability. a–d) Live/dead (green/red) fluorescence staining i) 24 h postexposure (see Tables S2 and S3 in the Supporting Information for tabulated live cell percentage) and ii) formazan absorbance (MTS assay; metabolic activity) are presented. MTS assay data analyzed using one‐way ANOVA with Tukey post hoc testing. iii) Growth rate extracted from MTS data is presented for all cell lines. All data presented as mean ± SD from triplicate samples (n = 9). Scale bar, 50 µm. Statistically different samples are denoted by *p < 0.05, **p < 0.005.