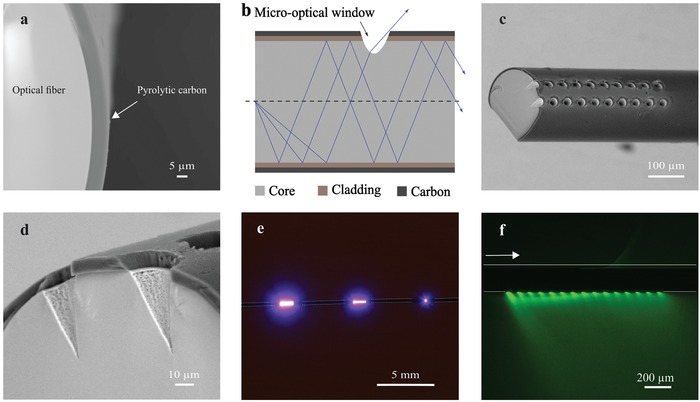
Figure 2.

a) SEM showing the cross section of an optical fiber after pyrolysis (8 µm thick pyrolytic carbon layer (dark gray) surrounding the cladding and core (light gray) of the fiber). b) Schematic view of the functional principle of a leaky optoelectrical fiber (LOEF). c) SEM of an LOEF with a 2 × 10 array of laser ablated micro‐optical windows. d) Close‐up of LOEF showing the side‐walls of micro‐optical windows. e) Photo showing different light leak intensity from a pattern of a single, 1 × 10 and 2 × 10 micro‐optical windows (from right to left). f) Image of fluorescent nanobeads in gelatin surrounding the LOEF showing the spatial distribution of light leak. The arrow indicates the direction of light coupling.
