Figure 4.

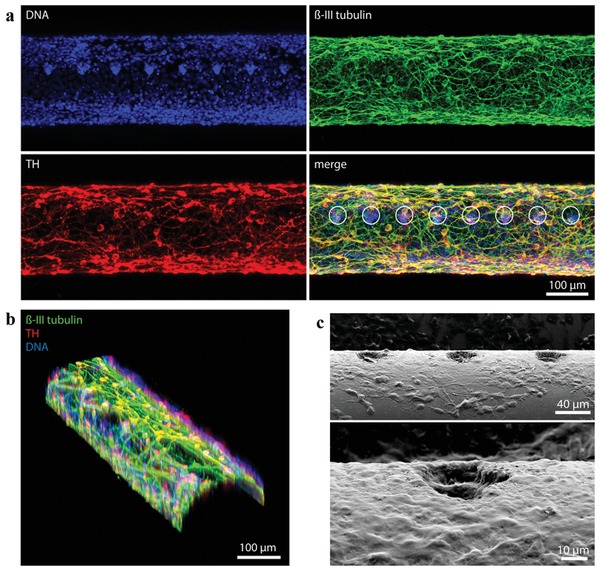
Differentiation of hNSCs into dopaminergic neurons on an LOEF: a) Fluorescence maximum intensity projection of 17 optical sections spanning 100 µm of LOEF. Immunocytochemistry shows an even coverage of the LOEF by the differentiated neurons: ß‐III tubulin (green); TH (red); nuclei (blue); merge (green, red, blue). White circles mark micro‐optical windows. b) 3D reconstruction of the fluorescence images showing cell coverage of the curved surface of LOEF. c) SEM images indicating cell growth on and into the micro‐optical windows of the fiber.
