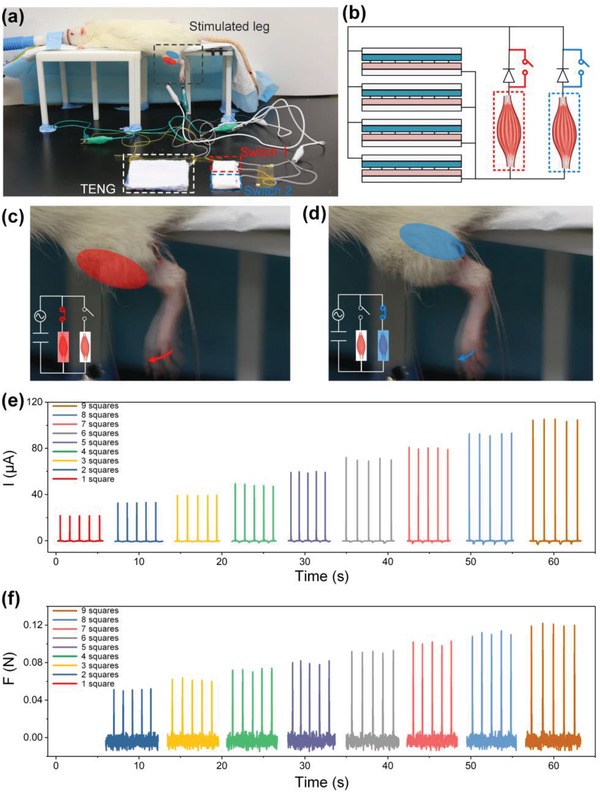
Figure 5.

Direct muscle stimulation with the D‐T‐TENG. a) Images of the testing set up for the rat tibialis anterior muscle and gastrocnemius muscle stimulation. b) Circuit diagram of selective muscle stimulation. c) Image of the rat leg motion when the tibialis anterior muscle is stimulated. d) Image of the rat leg motion when the tibialis gastrocnemius muscle is stimulated. e) Current profile over a 1 MΩ load of the D‐T‐TENG when different number of squares are pressed. f) The corresponding force profile of the rat leg when it is induced to move forward by pressing different number of squares of the D‐T‐TENG.
