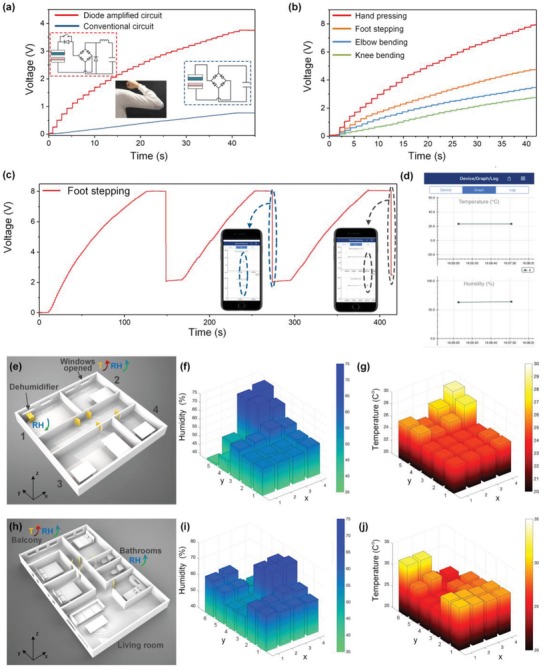
Figure 8.

D‐T‐TENG powered Bluetooth sensing. a) Charging curves on the 27 µF capacitor of the D‐T‐TENG and T‐TENG as the elbow bends 120°. The insets show the circuit diagram for the D‐T‐TENG (left) and for the sole T‐TENG (right). b) Charging curves with the D‐T‐TENGs from different body parts. c) Charging and discharging curve with the D‐T‐TENG on foot, where each voltage drop represents a discharging to the Bluetooth module. d) Enlarged screenshot on a smartphone showing the collected information from the Bluetooth module. e) 3D layout of a lab environment. f,g) Humidity and temperature distribution of the lab environment with 20 sampling points. h) 3D layout of an apartment. i,j) Humidity and temperature distribution of the apartment with 24 sampling points.
