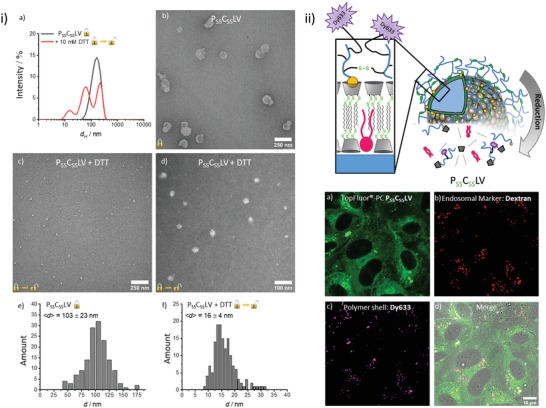
Figure 2.

Morphology and cellular delivery of PSSCSSLV. i) Size change due to reductive disassembly of the nanocontainers. a) Intensity‐weighted size‐distribution of PSSCSSLV determined by DLS before and after treatment with 10 × 10−3 m DTT. A CONTIN‐algorithm for polydisperse samples was used for the analysis. b) TEM images of PSSCSSLV. c,d) TEM images following reductive cleavage. After 24 h of incubation in 10 × 10−3 m DTT, samples were negatively contrasted by 0.5% (w/v) tungstophosphoric acid. e,f) Size distribution of PSSCSSLV determined by TEM e) before and f) after 24 h incubation in 10 mm DTT. ii) Intracellular delivery of TF–PC incorporated into PSSCSSLV. Top: Schematic representation of the structure of PSSCSSLV containing a Dy633‐labeled polymer shell. Bottom: HUVEC were incubated for 2 h with Dy633‐labeled PSSCSSLV containing TF‐labeled PC and analyzed by confocal microscopy. Images show the uptake of the PSSCSSLV and the intracellular release of TF–PC. The fluorescent label of the polymer shell, Dy633, is retained in endosomal structures as revealed by labeling with co‐internalized RhB–dextran.
