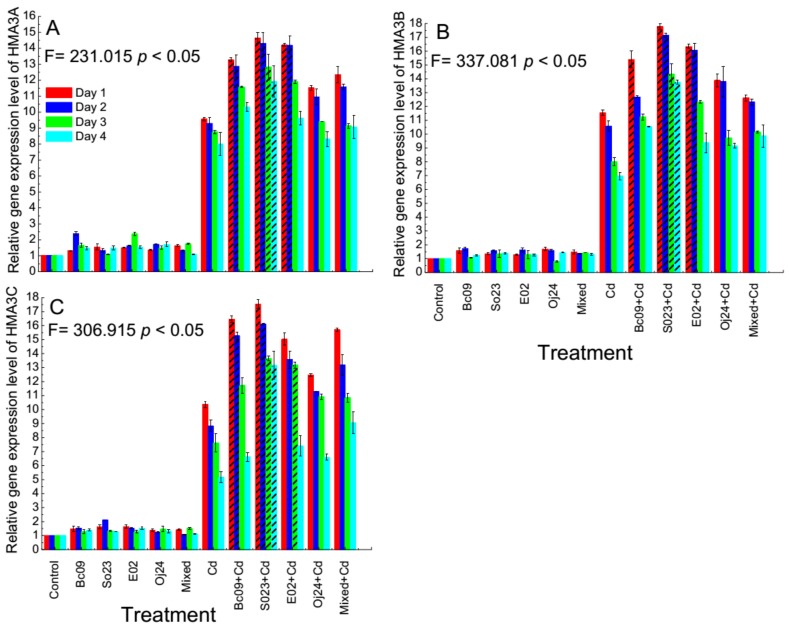
Figure 5.
Expression of HMA3 genes in the roots and shoots of the switchgrass cv Alamo. Relative gene expression level of (A) HMA3A = AP13CTG05330TIGR01512; (B) HMA3B = AP13CTG10982TIGR01512; (C) HMA3C = Pavir.Ba03387.1. Control = noninoculated control plant without Cd stress; Cd = noninoculated Cd-control plant with 20 µ mol L−1 CdCl2 stress; Bc09, So23, E02, Oj24, and Mixed (combination of the four strain) = plant inoculated with endophytic PGPB without Cd stress; and Bc09 + Cd, So23 + Cd, E02 + Cd, Oj24 + Cd, and Mixed + Cd (combination of the four strain) = plant inoculated with endophytic PGPB with 20 µ mol L−1 CdCl2 stress. The dash pattern indicates the biomass of that treatment is significantly different among the treatments. The expression of HMA3 genes was determined by quantitative real-time PCR. FTSH protease 4 (FTSH4) was used as internal control. Each column represents the relative gene expression levels (mean value ± SD, with three biological repeats each with 3 technical repeats) calculated using 2-∆∆CT method.

