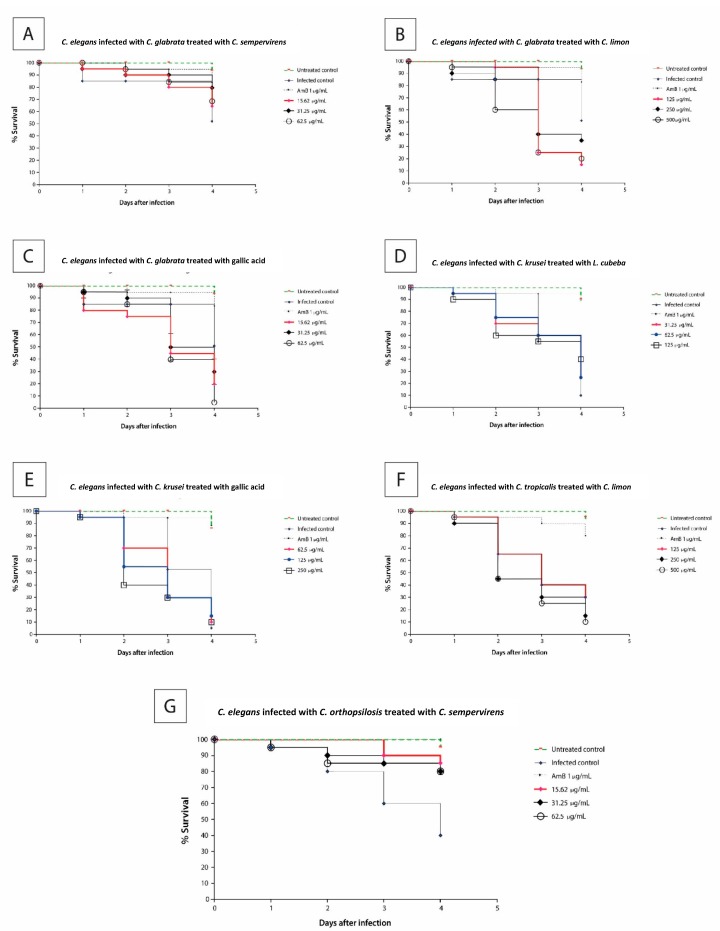
Figure 2.
Survival curves of the responses to the tested compound concentrations from the Caenorhabditis elegans–Candida infected model. Nematode survival diminished at 0.5 × MIC, 1 × MIC, and 2 × MIC for all the compounds, except for the Cupressus sempervirens EO. (A)—C. elegans infected with C. glabrata and treated with C. sempervirens EO, (B)—C. elegans infected with C. glabrata and treated with C. limon EO, (C)—C. elegans infected with C. glabrata and treated with gallic acid, (D)—C. elegans infected with C. krusei and treated with L. cubeba EO, (E)—C. elegans infected with C. krusei and treated with gallic acid, (F)—C. elegans infected with C. tropicalis and treated with C. limon, (G)—C. elegans infected with C. orthopsilosis and treated with C. sempervirens. The untreated control group is represented by the green lines; the infected control, the fungicidal control drug (amphotericin B), and the different concentrations of the tested compounds are represented by symbols. The results were obtained from three independent experiments with at least three replicates.

