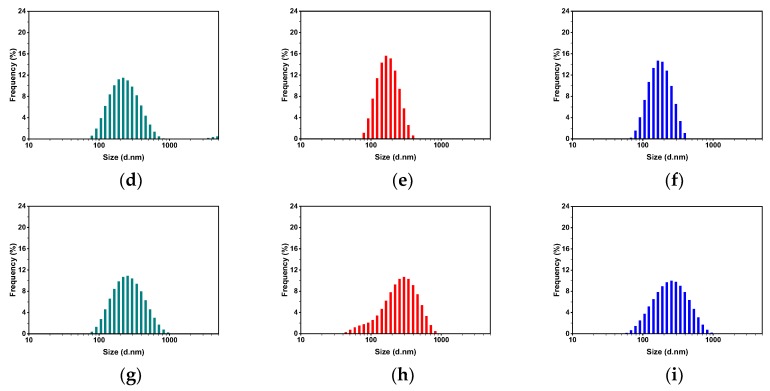
Figure 2.
Particle-size-distribution histograms (by intensity) for PS-b-P4VP(59)/ethanol solutions at the last measurement points of different temperature-treatment conditions: (a,d,g) at 25 °C before heating cycle; (b,e,h) upon heating cycle at (b) 50, (e) 40, and (h) 30 °C; and (c,f,i) at 25 °C after heating and subsequent cooling cycles. The corresponding measurement points, which related to each size-distribution histogram, are marked with corresponding colors in Figure 1.


