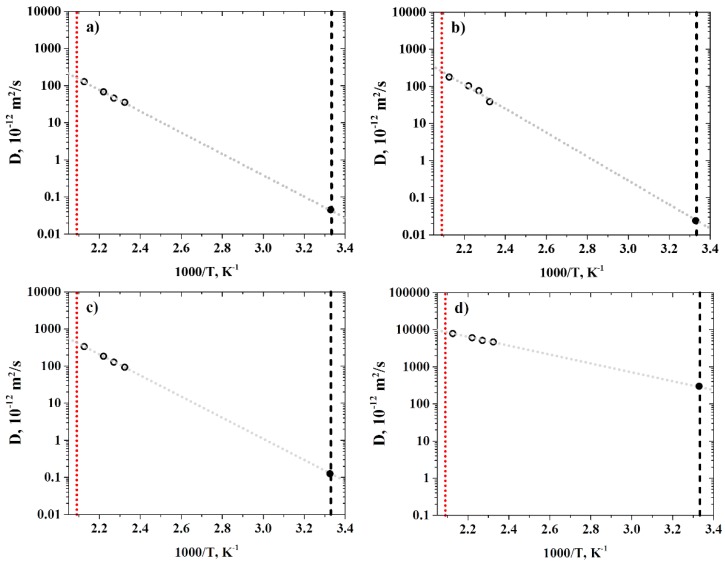
Figure 6.
Dependence of the diffusion coefficients of (a) CH4, (b) N2, (c) O2, and (d) He in R-BAPB on the reciprocal temperature obtained in molecular dynamics simulations. Semi-logarithmic axes. The red dotted line indicates the glass transition temperature of R-BAPB. The black dashed line corresponds to T = 300 K. The solid black symbols indicate the diffusion coefficients at T = 300 K, obtained by extrapolating the diffusion coefficients at higher temperatures, using the Arrhenius Law. The error bars are of the size of the symbols.

