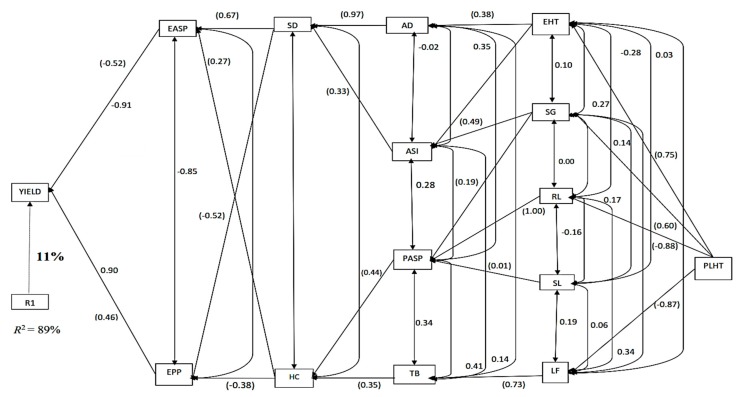
Figure 4.
Path analysis diagram depicting the causal relationship of measured traits of the 36 maize accessions under combined drought and heat stressed conditions. Note: Value written in bold is the error effects; the direct path coefficients are values in parenthesis and other values are correlation coefficients. R1 is error effects, R2 = coefficient of determination.

