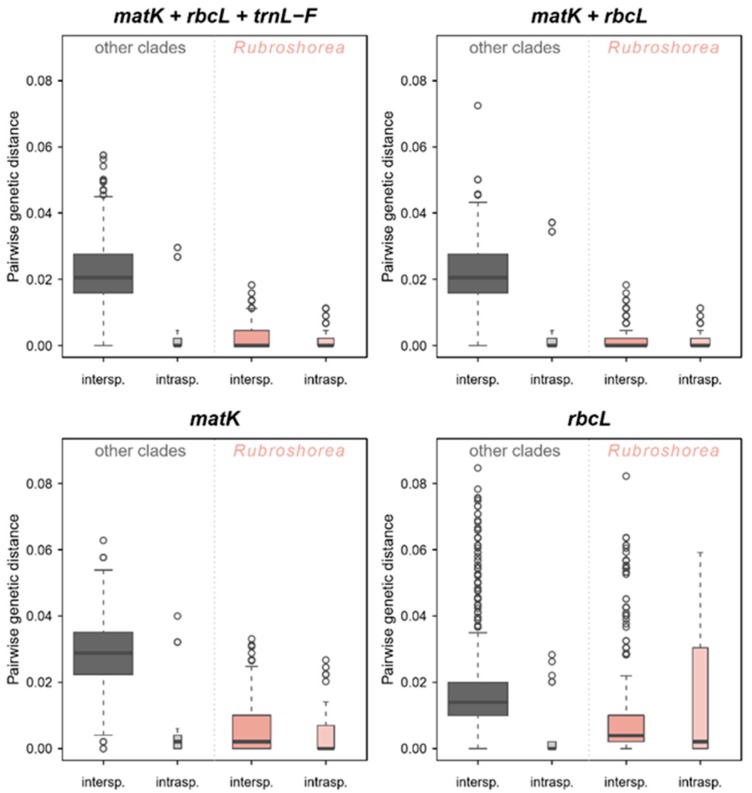
Figure 2.
Boxplot representation of intraspecific (intrasp.) and interspecific (intersp.) pairwise genetic distances for the Dipterocarpaceae family based on each traditional barcode marker and the combined dataset: matK + rbcL + trnL-F; rbcL + matK; matK; and rbcL. Rubroshorea was plotted separately since the barcode makers used in this study failed to differentiate this section at species level. The width of each boxplots is proportional to the square-roots of the number of observations.

