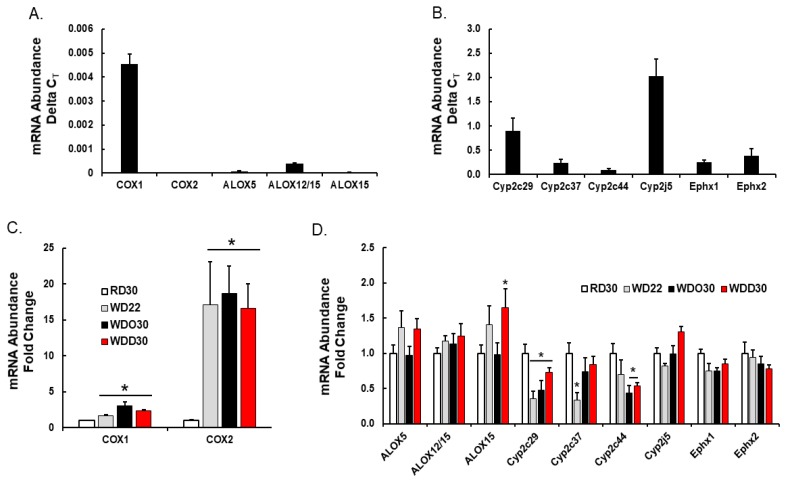
Figure 7.
Diet effects on hepatic enzymes involved in oxylipin metabolism. Hepatic RNA was extracted, converted to cDNA and used to quantify transcript abundance using qRTPCR as previously described [52]. The primers used to measure each transcript were previously described [51,60]. Cyclophilin was used as the reference gene. (Top panels A,B): Relative abundance of transcripts encoding enzymes involved in hepatic oxylipin metabolism. Results are presented as delta CT, mean ± SEM. (Lower panels C,D): Diet effects on hepatic transcripts encoding enzymes involved in oxylipin metabolism. Results are presented as Fold Change, mean ± SEM; *, q < 0.05 vs. RD30. COX, cyclooxygenase; ALOX, arachidonic lipoxygenase; CYP, cytochrome P450, Ephx1, microsomal epoxide hydrolase; Ephx2, soluble epoxide hydrolase.

