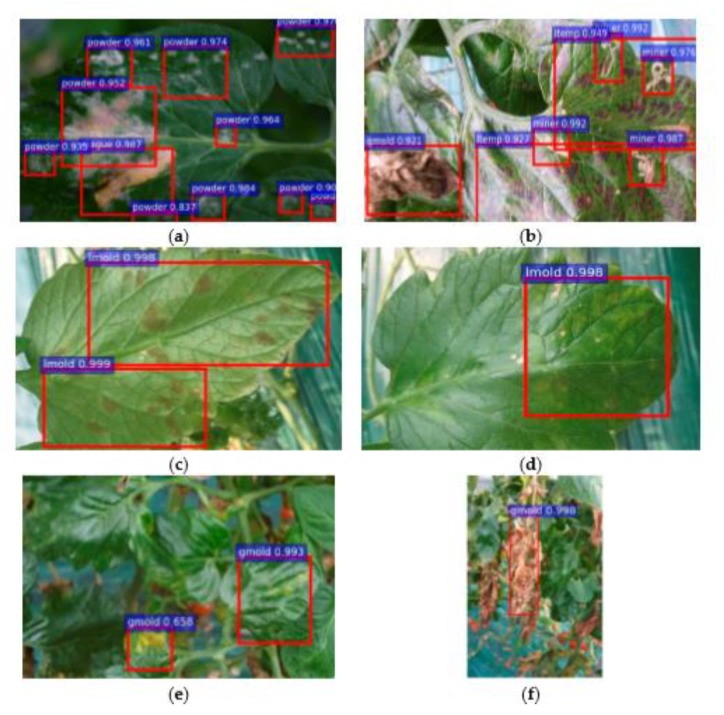
Figure 7.
Bounding box indicates the type of diseases along with the probability of their occurrence [68]. A bounding box technique was used in Figure 7 in which (a) represents the one type of disease along with its rate of occurrence, (b) indicates three types of plant disease (miner, temperature, and gray mold) in a single image, (c,d) shows one class of disease but contains different patterns on the front and back side of the image, (e,f) displays different patterns of gray mold in the starting and end stages [68].

